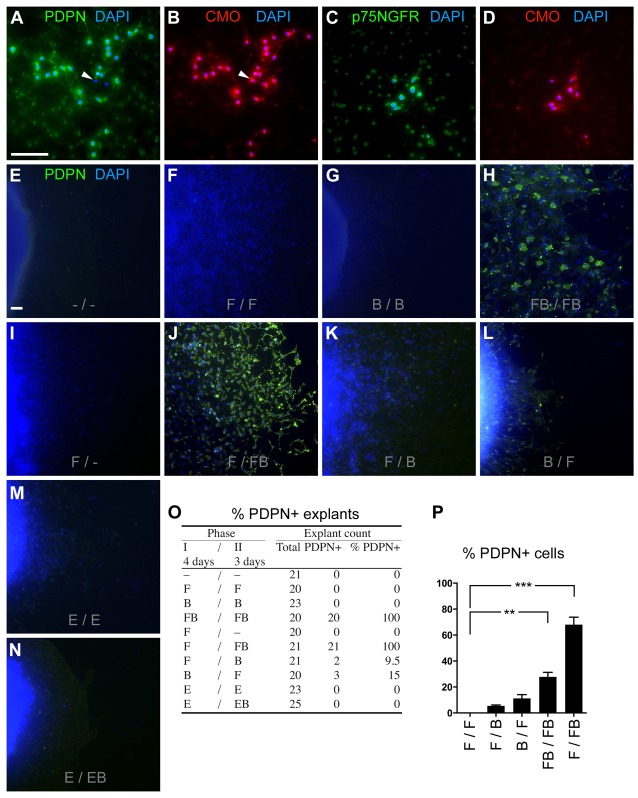
Fig. 2.
Invading/migrating NSCs express PDPN. Double staining of invasive NSCs (bottom of Boyden chamber) showing PDPN (A) and p75NGFR (C) expression of CMO/DAPI-positive cells (B and D). Only few cells (arrowheads) did not express PDPN. (E–N) PDPN was used as an invasion marker under growth factor combinations as indicated, and was found in migrating cells at the edge furthest away from the explant center. PDPN and DAPI staining of migrating NSCs showed PDPN expression in the conditions F/FB, FB/FB, F/B and B/F only. (O,P) Number of PDPN+ explants and the percentage of PDPN+ cells among the PDPN+ explants are indicated. F/F, B/B, F/-, E/E, E/EB did not contain PDPN+ cells (P). Scale bars: 100 µm (A–D), 50 µm (E–N). **P = 0.0015; ***P<0.0001.

