Fig. 4.
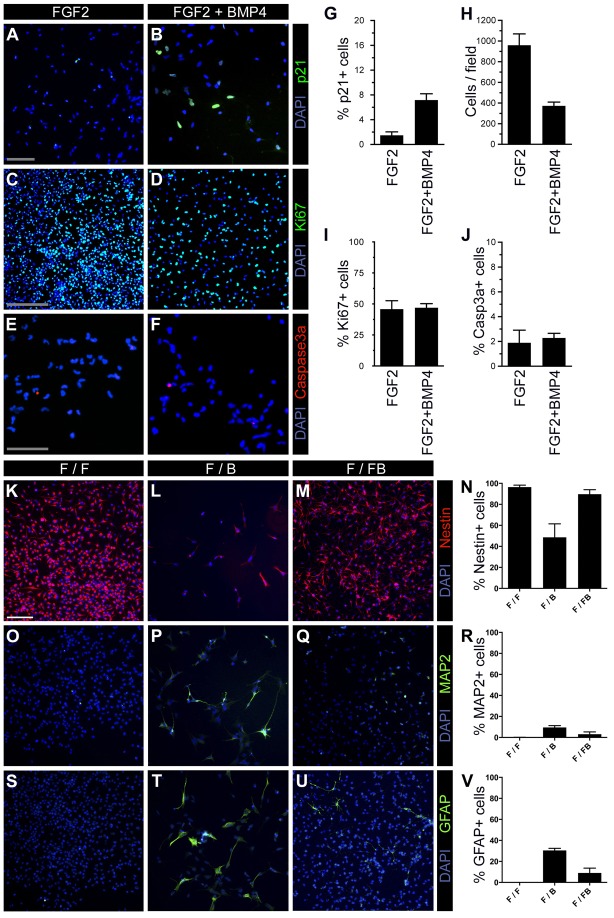
FGF2/BMP4 induces cell cycle inhibition, and slows down proliferation and differentiation. NSCs were exposed to FGF2 for 4 days then passaged and treated with or without BMP4 in combination with FGF2 for 5 days (A–J) and for 3 days (K–V), and were stained for p21/WAF1 (A,B), Ki67 (C,D), Caspase3a (E,F), Nestin (K–N), MAP2 (O–R), GFAP (S–V), together with DAPI. The F/FB group showed a higher p21-expressing cell proportion and lower total cell number (G,H, n = 3, P<0.0001 and P = 0.001, respectively). The proportion expressing Ki67 and Caspase3a did not show significant changes (I,J, n = 3). Nestin was strongly expressed in the F/F and F/FB group, whereas the F/B cells showed a marked reduction (K–N, n = 3, P<0.05 in F/F vs F/B, F/FB vs F/B, but no significant difference between F/FB and F/F). MAP2 was not found in the F/F group (O). A higher proportion of MAP2-positive cells was found in the F/B compared with the F/FB group (P–R, n = 3, P<0.05 F/F vs F/B, no significant difference in F/FB vs F/B and in F/F vs F/FB). No GFAP signal was observed in the F/F cells (S–V, n = 3, P<0.05 in F/F vs F/B and F/B vs F/FB, no significant difference between F/FB and F/F). Scale bars: 100 µm (A–D, K–M, O–Q, S–U); 50 µm (E,F).

