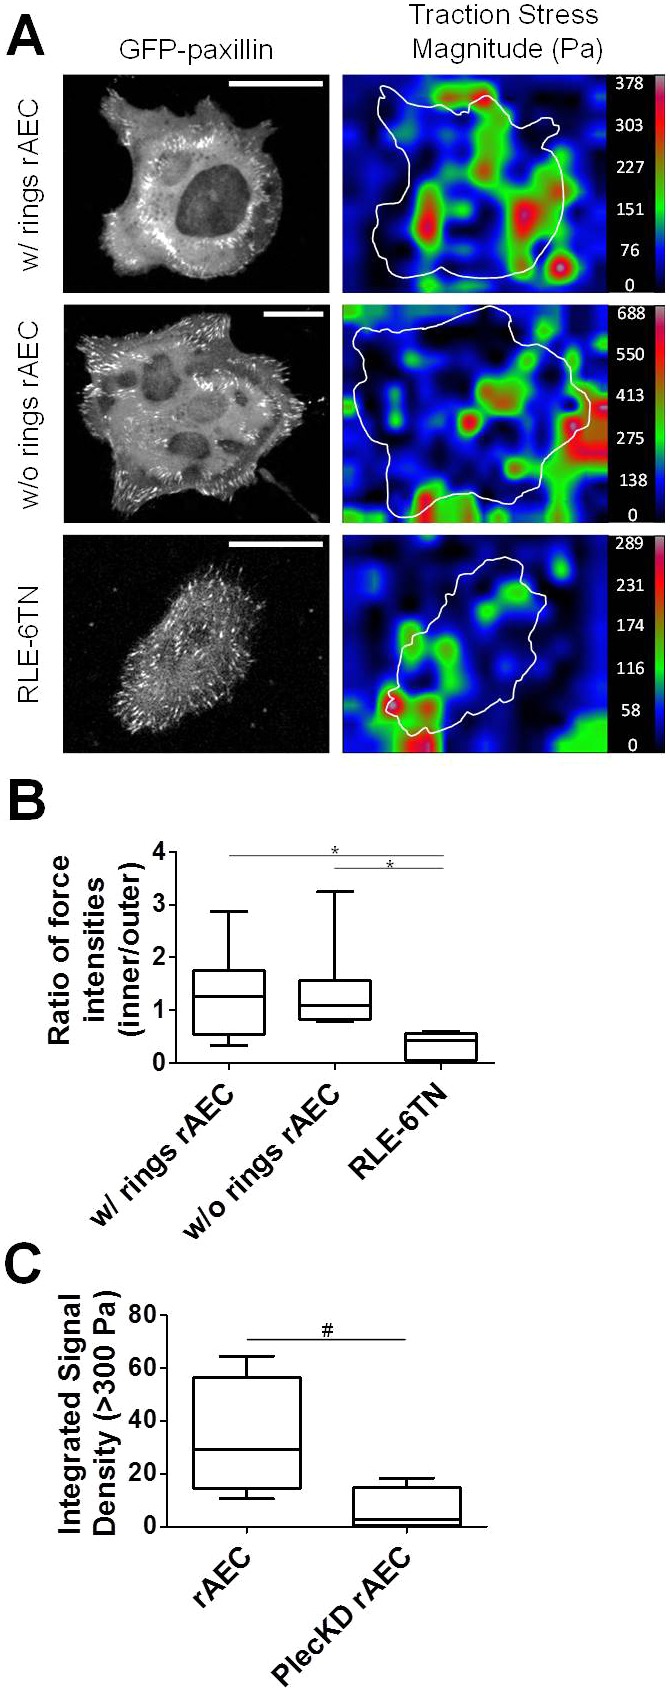
Fig. 6.

cFAs in rAEC exert significantly greater internal traction forces than other cells lacking cFAs. (A) GFP–paxillin-expressing rAEC and RLE-6TN cells were seeded onto polyacrylamide gels and then processed for traction force analysis. The images on the left show GFP–paxillin, and the images to the right are of reconstructed force maps, demonstrating traction force generation in an individual representative cell. Traction forces are color-coded by traction force stress magnitude as shown on the right (scale shown in Pa). (B) Box and whiskers plot of the ratio of forces elicited by at least four pFAs and four cFAs in rAEC exhibiting double FA rings (w/rings) and those without (w/o rings) as well as RLE-6TN cells. The mean force ratio for each cell population (n = 7–9 cells each) is indicated by a bar in the boxes; *P<0.05. (C) Box and whiskers plot of total traction forces greater than 300 Pa for rAEC and Plec KD rAEC. Loss of plectin results in a decrease in overall traction force. The plot shows the mean integrated signal density for forces >300 Pa for each cell population (n = 4–5 cells for each); #P<0.05. Scale bars: 20 µm.
