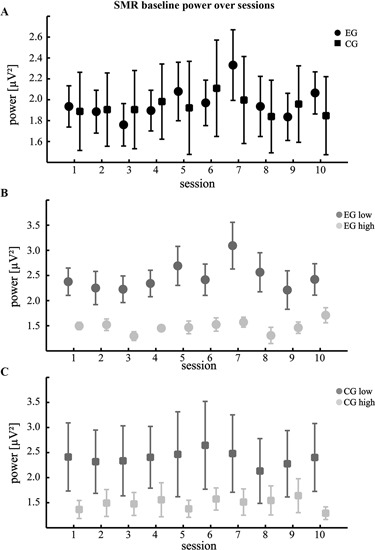
Figure 2.

Changes of SMR power during baseline. (A) Mean absolute SMR power across 10 training sessions during the baseline condition. Participants of the EG were watching a visual feedback of their own brain activations without trying to gain control, while participants of the CG were watching a pre-recorded video (B,C) comparison according to the individual control beliefs (same conventions as in Figure 1).
