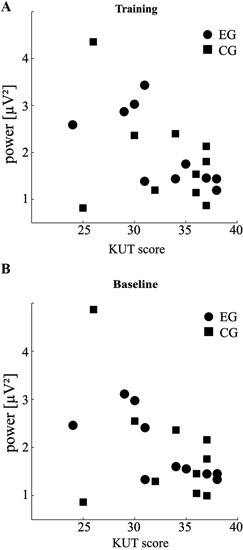
Figure 3.

SMR power correlates with control belief. (A) Scatter plot of individual KUT scores against overall SMR power during feedback training (total n = 60 runs per participant). (B) Same as in (A) for baseline runs (total n = 10 runs per participant). For details of the relationships please see subsection “Overall Correlation of KUT and SMR Power” in Results.
