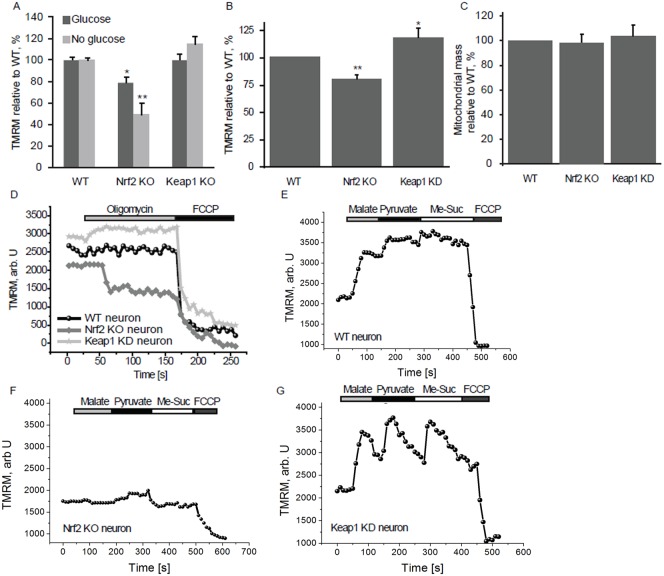
Fig. 1. Nrf2 affects the mitochondrial membrane potential.
(A) Mitochondrial membrane potential in WT, Nrf2-KO and Keap1-KO MEFs in the presence or absence of glucose determined by TMRM fluorescence. (B) Mitochondrial membrane potential in primary cortical neurons from WT, Nrf2-KO and Keap1-KD mice. (C) Relative mitochondrial mass in Nrf2-KO and Keap1-KD cortical neurons compared to WT cells, measured as the co-localisation of TMRM with the cytosolic calcium dye fluo-4. (D) TMRM fluorescence in WT, Nrf2-KO and Keap1-KD cortical neurons after addition of oligomycin (2 µg/ml) and FCCP (0.5 µM). (E–G) TMRM fluorescence after sequential addition of malate, pyruvate and methyl succinate (5 mM each) in WT (E), Nrf2-KO (F) and Keap1-KD (G) cortical neurons. FCCP was added in the end to fully depolarise the mitochondria. Data presented as mean percentage compared to WT ± SEM *P<0.05 **P<0.001.

