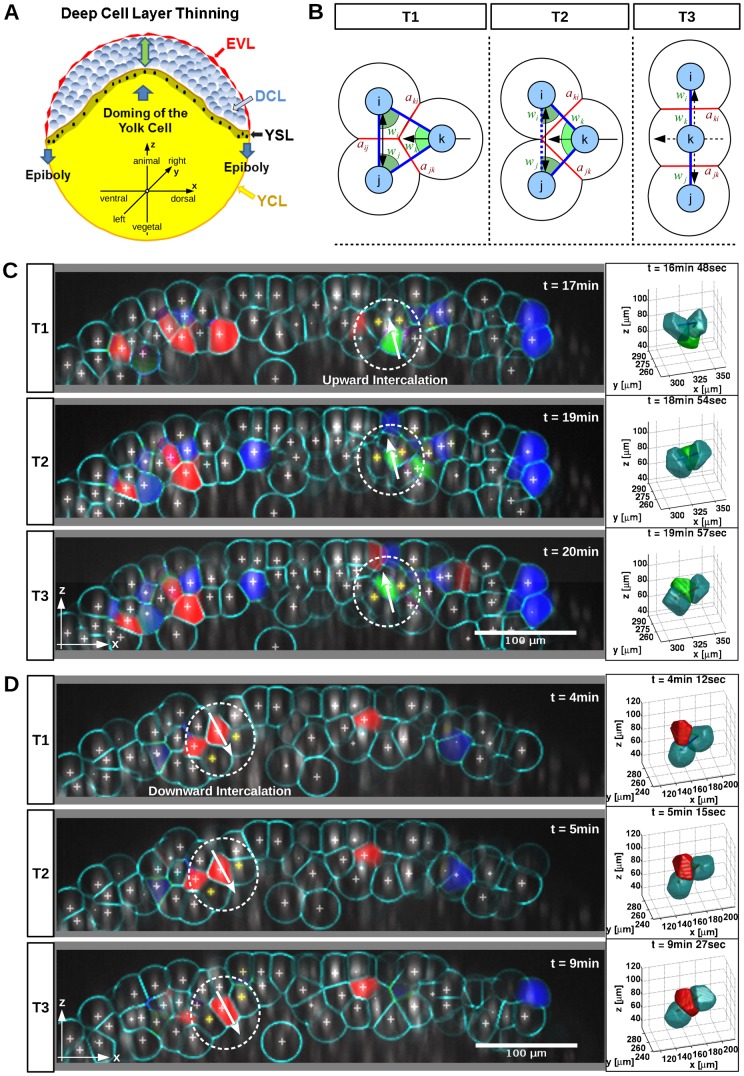
Fig. 1. Automated detection of intercalating zebrafish blastomeres.
(A) Schematic view of DCL thinning and epiboly during zebrafish early gastrulation with coordinate systems used. (B) Three-stage (T1 to T3) model of cell intercalation for point triple analysis. The cell located in the center (k) intercalates between the neighboring cells (i and j). Pairwise distances (blue), enclosing angles (green) and contact areas (red). (C,D) Computational detection and classification of radial intercalations from 3D time-lapse recording (supplementary material Movies 1, 2). Embryo stages: sphere to 50% epiboly. The rendering shows lateral views (animal pole at top) with raw nuclei fluorescence (grey), tracked nuclei positions (crosses) and calculated cell boundaries (cyan). Arrows indicate direction of cell migration. Upward (green), downward (red), and lateralward intercalations (blue) were detected along an 18 µm thick animal–vegetal oriented sheet transecting the embryo along its dorsoventral axis (shown here as y-projection representing 18 µm orthogonal to the z-stack). In the circled areas, a blastomere intercalates between two neighboring cells (yellow crosses) located in adjacent more exterior level (C) or in adjacent more interior level (D). These two groups of cells were separately rendered in 3D (right). Scale bars: 100 µm.

