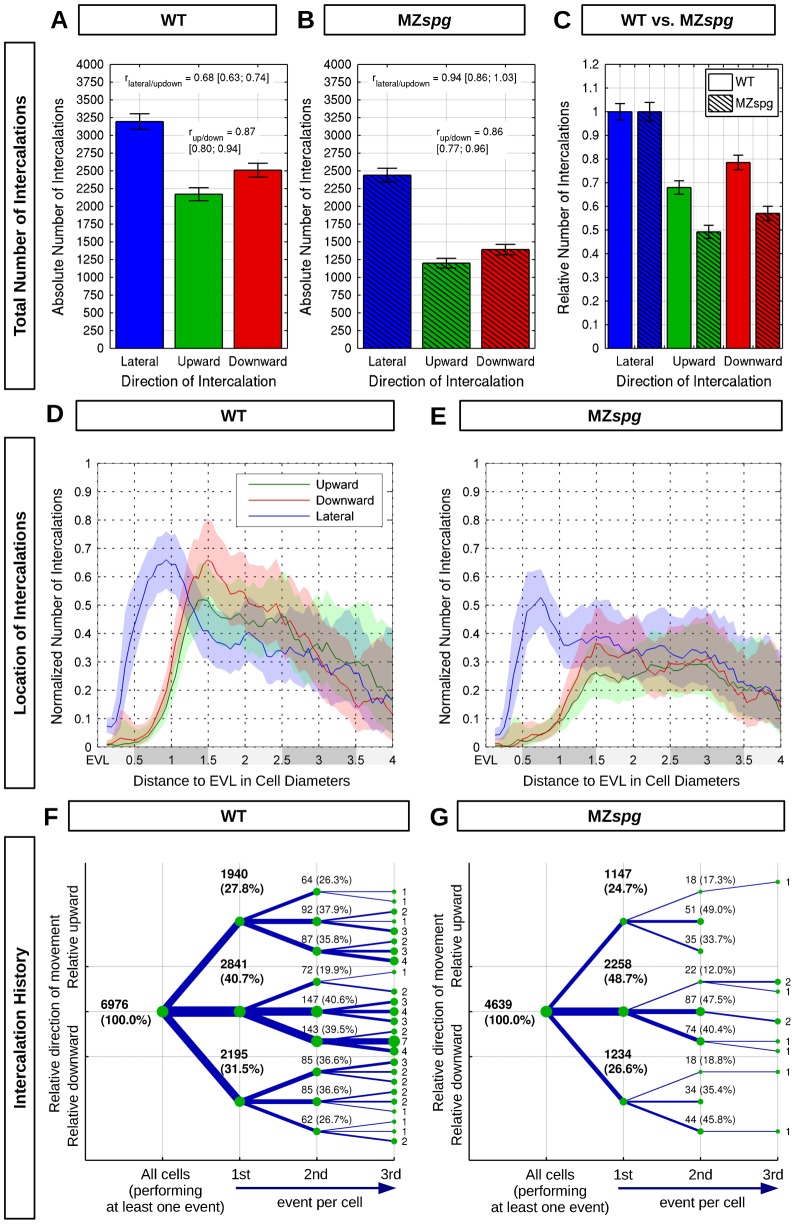
Fig. 3. Quantification of radial and lateral intercalation events.
(A,B) Absolute number of lateralward, upward, and downward intercalations in WT and MZspg (summed over 6 embryos for WT and MZspg each). Ratios between up- and downward, and between lateral and up-/downward intercalations are shown in each graph. (C) Relative number of upward or downward intercalations normalized to the number of lateralward intercalations. (D,E) Quantification of WT (D) and MZspg (E) blastomeres performing upward, downward, or lateralward intercalations in each depth level. Depth levels (shaded grey along x-axis) were numbered and distance was measured starting from the EVL in vegetal direction. To be able to compare different depth levels, the absolute number of intercalations (summed over 6 embryos for WT and MZspg each; supplementary material Fig. S1) was normalized by the total number of cells observed for each distance. The x-axis is truncated at 4.0, where the number of measured intercalations becomes too small to provide meaningful results. (F,G) Summarized intercalation history of all individual cells (sum over six embryos for each genotype). The graph presents up to three successive intercalations of individual blastomeres, indicating upward, downward, or lateralward directions. The root node (leftmost) denotes all cells performing the first intercalation event. The absolute number and relative fraction of intercalations is given at each node. Errors are given by 95% confidence intervals assuming Poisson noise.

