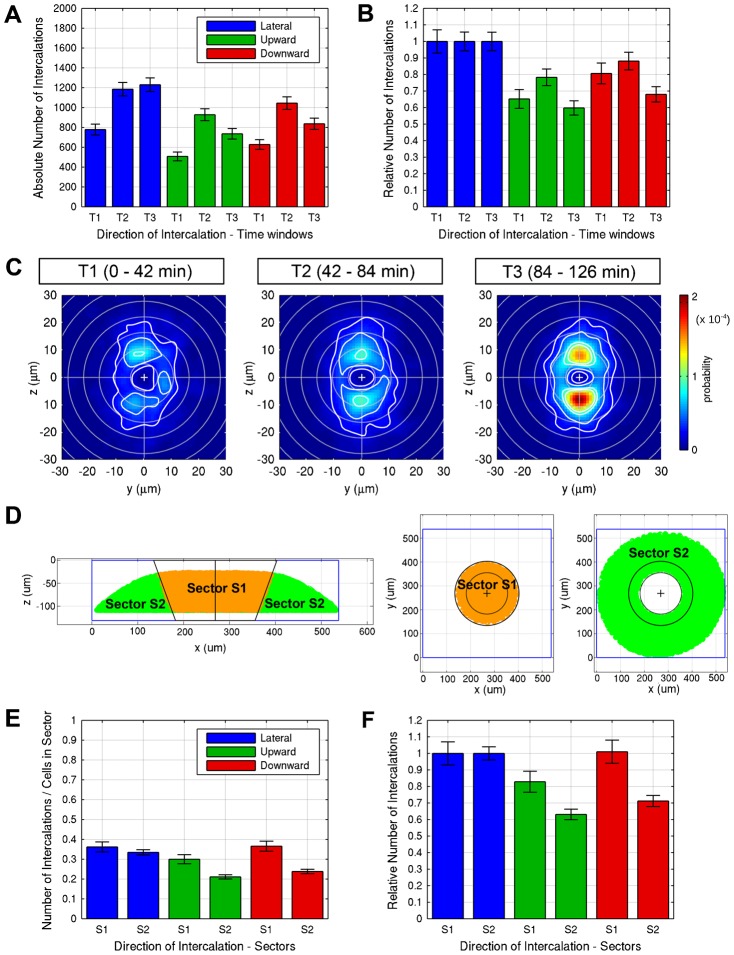
Fig. 5. Analysis of spatial and temporal patterns of intercalation.
(A,B) Absolute number (A) of lateralward, upward, and downward intercalations in WT for the time windows T1 (0–42 min), T2 (42–84 min), and T3 (84–126 min). The data are summed over 6 embryos each. (B) Relative number of upward or downward intercalations in each time window normalized to the number of lateralward intercalations. (C) Average motion directionality analyzed for WT embryos for each of the time windows T1 to T3. The occurrence probability for an intercalation with certain migration direction and displacement is indicated by color. Isocontours (white) denote lines of equal probability. Cross-sections of 3D directionality distributions are given for the y–z plane. (D) To analyze potential differences in intercalation behavior between an inner sector located centrally at the animal pole and an outer sector encompassing more marginal and vegetal cells, the 3D space of the image data stack was separated into an inner sector S1 (orange) and an outer sector S2 (green), visualized in lateral (left) and animal pole views (right).(E,F) Number (E) of lateralward, upward, and downward intercalations in WT for the sectors S1 and S2 normalized by the number of cells for each sector. The data are summed over 6 embryos each. (F) Relative number of upward or downward intercalations in each sector normalized to the number of lateralward intercalations.

