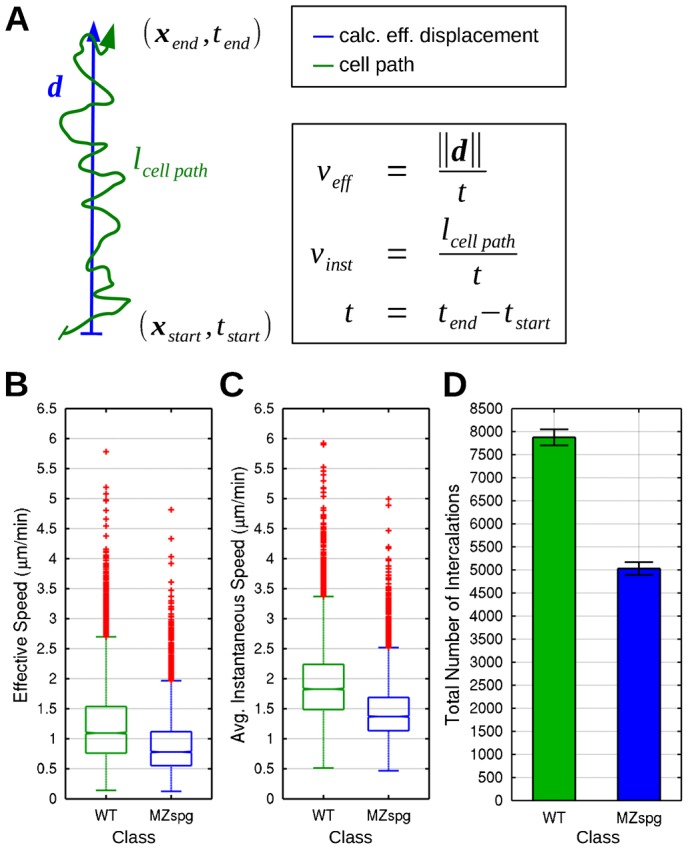
Fig. 6. Migration speed of intercalating cells.

(A–C) Radial intercalation dynamics. The effective and average instantaneous speeds of intercalating blastomeres were quantified. (A) Schematic drawing of cell path (green) and calculated effective displacement (blue) during intercalation. Calculation and comparison of effective (B) and average instantaneous speed (C) for WT and MZspg embryos (P<0.05; n = 6 embryos each WT and MZspg; Standard MATLAB boxplots). (D) Quantification of the total absolute number of intercalations for WT and MZspg embryos (P<0.05; summed over n = 6 embryos each WT and MZspg). Error bars show 95% confidence intervals assuming Poisson noise.
