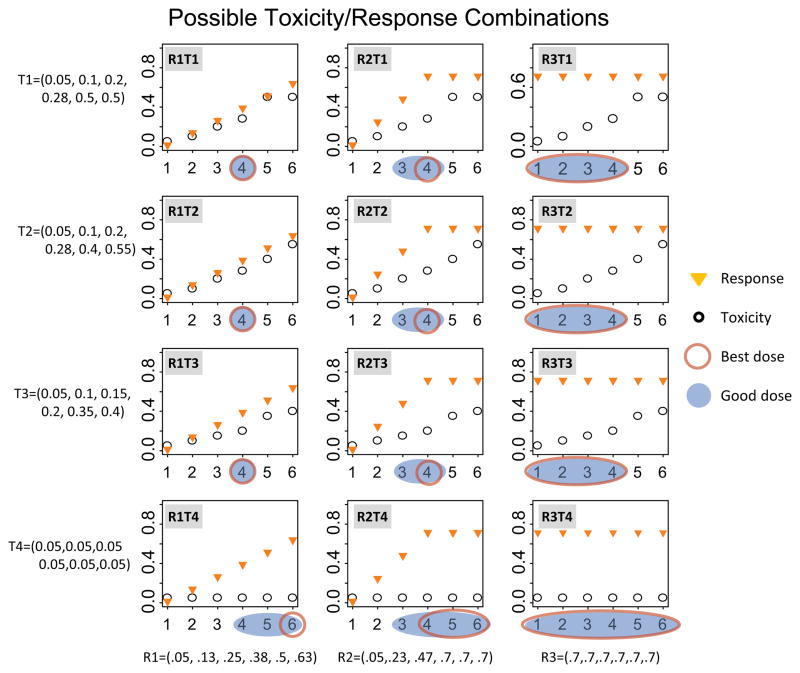
Figure 1.
Possible response and toxicity scenario combinations as a function of dose level. Plotted are the marginal probabilities of response and toxicity as a function of dose level.
Orange triangles indicate the probability of response and black circles indicate the probability of toxicity. Best and good dose levels are shown for all scenarios. A blue shaded area indicates a good dose level and a red oval indicates a best dose level.

