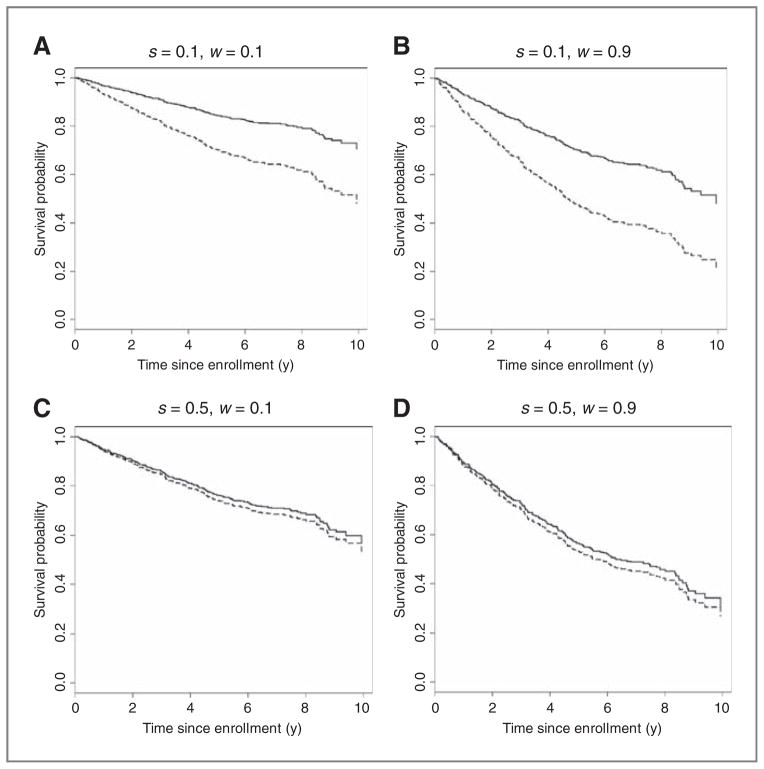
Figure 3.
A to D, the predicted survival curves when receiving thalidomide (solid curves) and no thalidomide (dashed curves) for 4 patients with different values of the predictive score (S) and the prognostic score (W); (s, w) = (0.1, 0.1), (0.1, 0.9), (0.5, 0.1), and (0.5, 0.9). s = 0.1 (0.5) represents a high (small) responsiveness to thalidomide, whereas w = 0.1 (0.9) represents a good (poor) prognosis.

