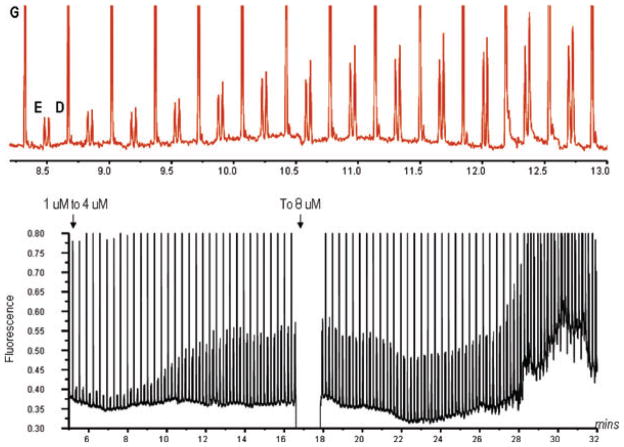
Figure 4.
Concentration change experiment with pre-derivatized glycine (G), glutamate (E), and aspartate (D). The top panel shows a snapshot of the rise time from 4 to 8 μM (from 9 to 12 min). The bottom panel demonstrates the continuous injections and separations with concentration changes at three points (1 μM–4 μM and then to 8 μM indicated by the arrows). Buffer conditions: 20 mM borate, 10 mM SDS at pH 9.2. The amino acids were derivatized with 7 mM NDA in ACN, 10 mM NaCN in 50 mM borate buffer at pH 9.2. Injection time is 0.5 s with a separation potential of 500 V/cm.

