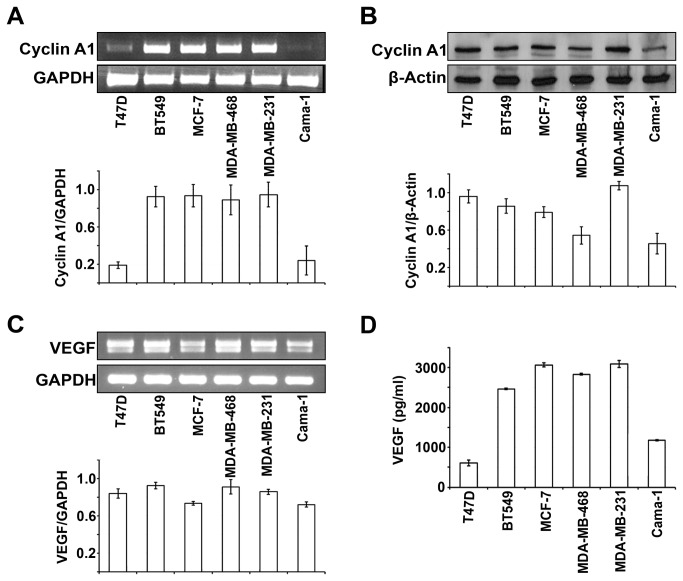
Figure 2. Evaluation of endogenous cyclin A1 and VEGF expression in breast cancer cell lines.
(A) Cyclin A1 mRNA levels are assessed in T47D, BT549, MCF-7, MDA-MB-468, MDA-MB231 and Cama-1 cell lines by semiquantitative RT-PCR and a representative picture is shown (upper panel). Quantification of cyclin A1 mRNA level is shown and mean ± SD represents three independent experiments (lower panel). (B) Western blot analysis of levels of cyclin A1 protein in the cell lines as indicated. A representative picture is shown (upper panel). Quantification of cyclin A1 protein level is shown and mean ± SD represents three independent experiments (lower panel). (C) VEGF mRNA levels are assessed in the indicated cell lines by semiquantitative RT-PCR and a representative picture is shown (upper panel). Quantification of cyclin A1 protein level is shown and mean ± SD represents three independent experiments (lower panel). (D) ELISA assay of VEGF secretion in breast cancer cell lines as indicated. Mean ± SD represents three independent experiments.

