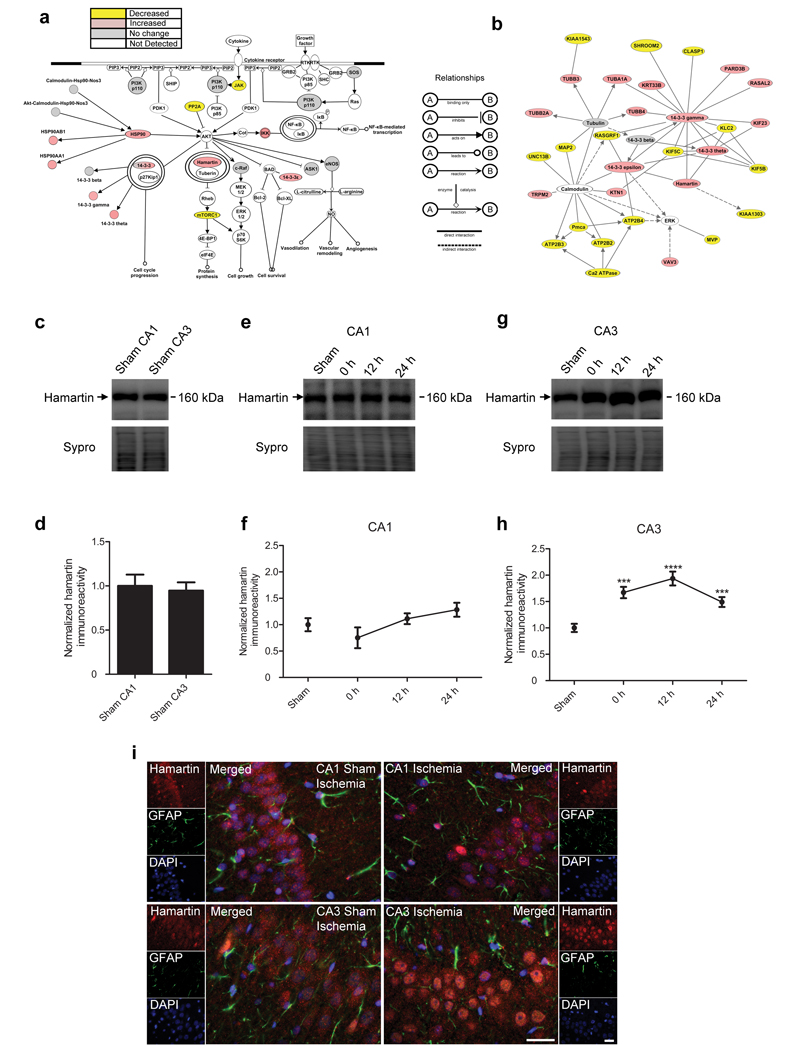
Figure 1. Hamartin expression is selectively induced in the CA3 hippocampal area following ischemia.
(a) Illustration of the PI3k/Akt pathway, which was significantly associated with and selectively induced in the CA3 region following ischemia (p=0.000319, right-tailed Benjamini-Hochberg multiple testing correction). Proteins are described in Supplementary Table 7. (b) Diagram of a protein network showing changes in expression levels significantly associated with ischemia in the CA3 region. In (a) and (b), proteins in pink and yellow were upregulated and downregulated respectively, by ischemia. Proteins in grey were detected by the proteomic analysis, but their expression was unaffected. Proteins in white participate in the pathway or network but were not detected in the proteomic study. Images were created using IPA software. The relationships between the displayed proteins are indicated. Proteins are described in Supplementary Table 8. (c–h) Representative immunoblots (c,e,g) of hamartin expression and densitometric quantification of the immunoblotting data in membrane fractions (d,f,h) from sham CA1 (n=11) and sham CA3 (n=12) (c,d) and following 10 min of ischemia (n=5) and 12 h (n=5) and 24 h (n=10) of reperfusion in CA1 (e,f) and CA3 (g,h) regions. Values were corrected for total protein content, determined by Sypro staining, normalized such that the expression levels from sham ischemia samples were 1 and presented as mean ± S.E.M. (one-way analysis of variance (ANOVA), Bonferonni’s post hoc test, ***p<0.001, ****p<0.0001, compared to sham ischemia). (i) Representative immunofluorescence images (n=4) of hamartin (red), glial fibrillary acidic protein (GFAP; green) and DAPI (blue) staining in sham ischemic and ischemic hippocampal sections, following 24 h of reperfusion. Merged images are shown. Scale bars: 20 μm.

