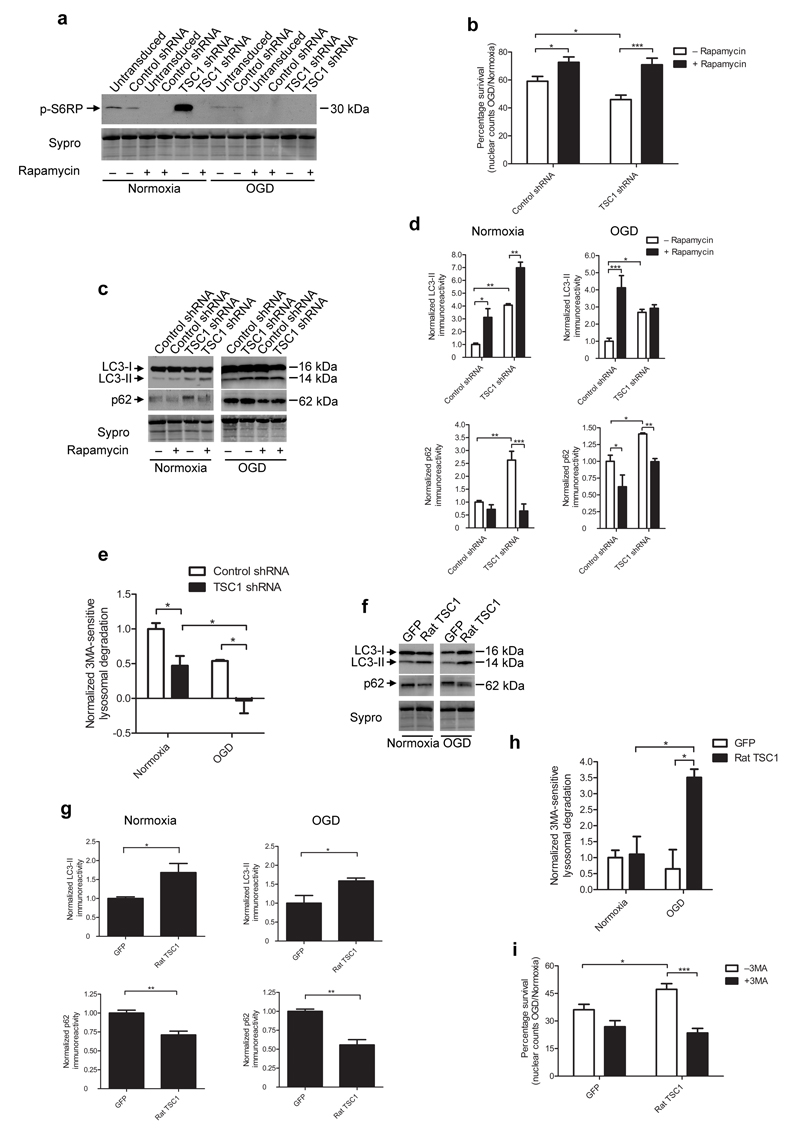
Figure 4. Hamartin promotes neuronal survival by inhibiting mTORC1 and inducing productive autophagy.
(a) Representative immunoblot of phosphorylated S6RP expression in control shRNA or TSC1 shRNA-transduced rat hippocampal neuronal cultures (under normoxia or OGD) in the presence or absence of 10 nM rapamycin (n=3). (b) Quantification of percentage survival (OGD to normoxia nuclear counts ratio) from control shRNA- or TSC1 shRNA-transduced cultures, with or without 10 nM rapamycin (n=3–9). (c,d) Representative immunoblots depicting LC3-I, LC3-II and p62 expression (c) and quantification of LC3-II and p62 levels (d) in the hippocampal cultures described in (a) (n=3). (e) Quantification of macroautophagy-dependent (3MA-sensitive) lysosomal degradation in control-transduced and TSC1 shRNA-transduced cultures (n=3). (f,g) Representative immunoblots of LC3-I, LC3-II and p62 expression (f) and quantification of LC3-II and p62 expression (g) from GFP- and rat TSC1-transduced cultures exposed to normoxia or OGD (n=3). (h) Quantification of macroautophagy-dependent lysosomal degradation in GFP- and rat TSC1-transduced cultures (n=3). (i) Quantification of percentage survival (OGD to normoxia nuclear count ratio) of GFP- and rat TSC1-transduced cultures, described in Figure 2i with or without 3MA (10 mM). For (d) and (g), data are normalized to control shRNA treated levels. Sypro staining was used as loading control. For (e) and (h), data are normalized to 3MA-sensitive degradation from control shRNA-transduced cultures following normoxia. Values are mean ± S.E.M. of n=3 independent experiments, and within each experiment at least triplicate samples per condition were assessed (two-way ANOVA with Bonferroni’s post hoc test (b, d, e, h, i) or two tailed t-test (g), *p<0.05, **p<0.01, ***p<0.001).

