
Figure 3.
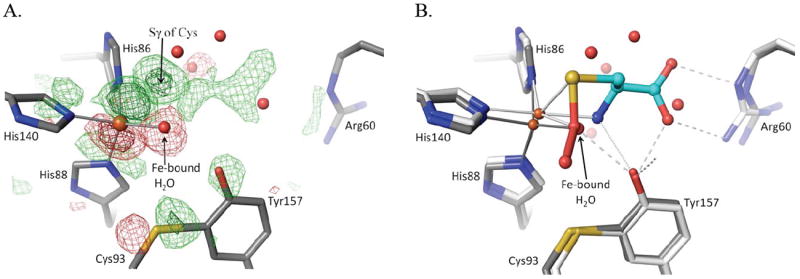
Active site changes upon Cys binding. (A) Fo-Fo difference map between the pH6.2-Cys soak and unliganded CDO (PDB entry 2B5H; Simmons 2006) using phases calculated from the unliganded structure. The unliganded model is shown (grey carbons) and the map contour levels are ±4.0 ρrms (light green/red) and ±10.0 ρrms (dark green/red). (B) Overlay, in the same view as panel A, of the models of unliganded (grey carbon atoms) and Cys-persulfenate bound (white/cyan carbon atoms) CDO. All waters shown are from the unliganded structure and are displaced by the bound ligand. The visible shifts of the iron and other active site residues and the placement of the persulfenate are consistent with the difference density shown in panel A.