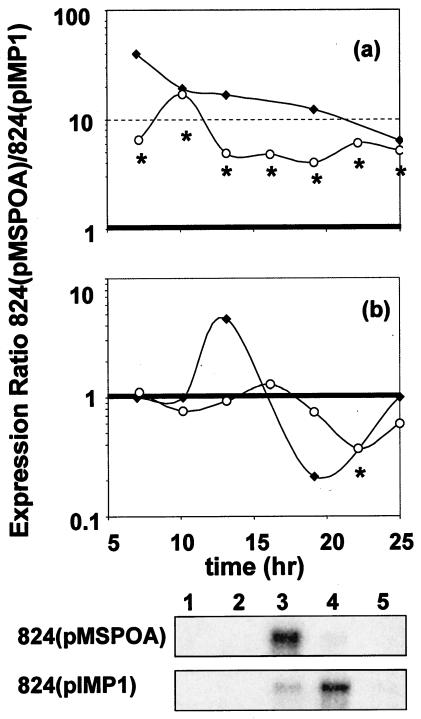
FIG. 2.
Comparison of ratios between 824(pMSPOA) and 824(pIMP1) spo0A (a) and aad-ctfAB (b) transcripts from microarrays (open circles) (this study) and Northern blot analysis (solid diamonds) (13). Asterisks indicate differential expression with a confidence level of at least 95% at the time point for the microarray data. The aad-ctfAB Northern blots are shown below the plots. Lanes indicate time points: 1 and 2, exponential growth, 3, transitional growth; 4 and 5, early-stationary phase. Total radioactive counts have been reported previously (13), and time points 1, 2, and 5 were treated as having equal (background) counts.

