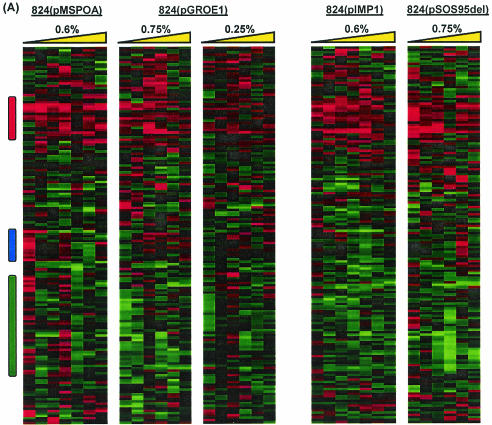
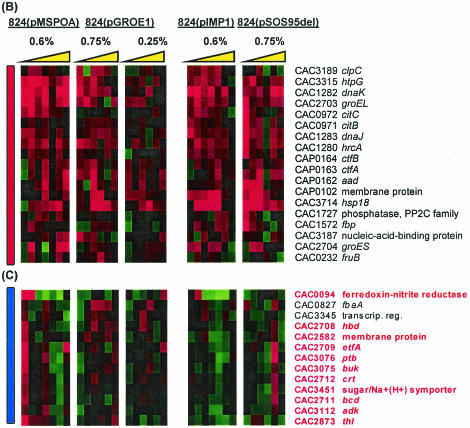
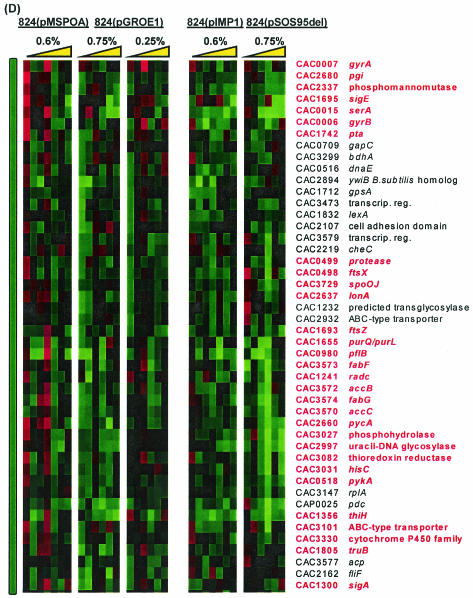
FIG. 8.
(A) Comparison of differential expression of genes due to butanol challenge in five experiments. Colored vertical bars indicate regions of interest shown in detail in panels with corresponding bars. (B through D) Detailed views of genes that were universally upregulated (B) (red), upregulated at 0.17 h postchallenge in 824(pMSPOA) but not in 824(pGROE1) (C) (blue), and upregulated at 0.17 and/or 2 h in 824(pMSPOA) but not at all in 824(pGROE1) (D) (green). 824(pMSPOA) and 824(pIMP1) samples were taken at 0.17, 0.5, 1, 2, 6, 12, and 24 h after butanol stress. 824(pGROE1) and 824(pSOS95del) samples were taken at 0.25, 1, 3, 6, 12, and 24 h after butanol stress. Yellow triangle represents the direction of increasing time following butanol stress.


