
Figure 3.
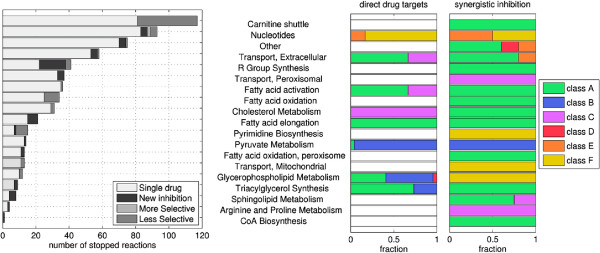
Drug synergisms for the human metabolic network. Left panel: For each affected pathway, the histogram reports the number of objective reactions which can be stopped; gray-scale bars represent reactions stopped only by a Single drug or multidrug solution, classified as New inhibition (meaning that no single drug is capable of triggering the inhibition), More selective and Less selective inhibitions (referring to the case where both single and multiple drug treatments are possible and the multiple one has respectively a lower and a higher side effect). Right panels: The two plots refer to multiple drug solutions only. For the same pathways as in the left panel, we report here the fraction of the direct drug targets and the fraction of the synergistic inhibitions which are induced by the six classes of synergisms (shown in Figure 2): the comparison between the two stacks shows that synergistic interactions can occur on pathways that are not direct targets of the drugs.