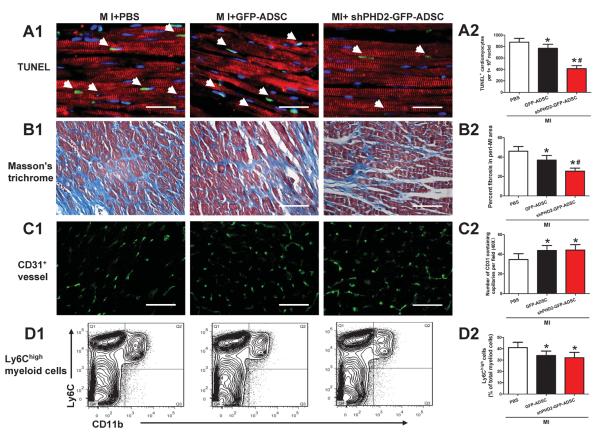
Figure 3.
Transplantation of ADSCs with PHD2 silencing reduces cardiomyocyte loss and fibrosis. A: Representative images (A1) and quantification (A2) of TUNEL+ cardiomyocytes in infarct border zone at 48 hours post-MI. TUNEL+ nuclei are stained green, tropomyosin is red and DAPI is blue. B: Representative images (B1) and quantification (B2) of fibrotic area in infarct border zone by Masson's trichrome staining at 4 weeks post-MI. For A and B, scale bar = 50 μm. C: Representative images (C1) and quantification (C2) of capillary density in infarct border zone at 4 weeks post-MI analyzed by CD31 staining. Scale bar = 30 μm. D: Representative contour plots (D1) and quantification (D2) of infiltrating monocyte population (Ly6Chigh/CD11b+) in cells isolated from infracted hearts at 48 hours post-MI analyzed by FACS analysis. N=6. * p<0.05 vs. MI+PBS; # p<0.05 vs. MI+GFP-ADSCs.

