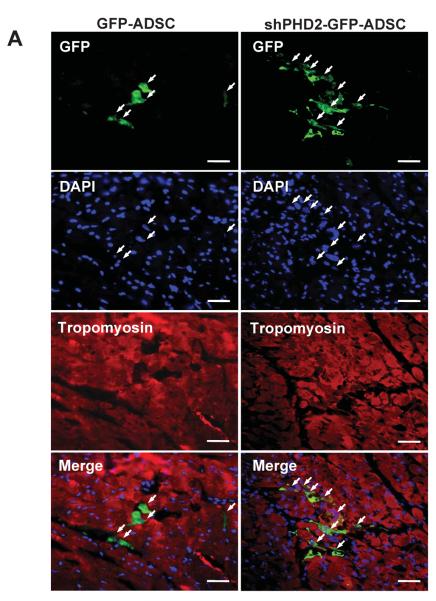
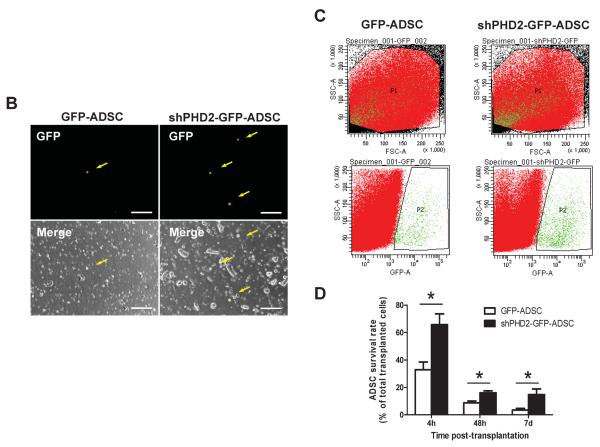
Figure 4.
PHD2 silencing increased ADSCs survival after transplantation to post-MI hearts. A: Representative images of survived GFP-ADSCs and shPHD2-GFP-ADSCs in hearts at 7 days after transplantation. Heart tissue was immunostained for Tropomyosin (red), GFP (green) and DAPI (blue). Scale bar = 50 μm. White arrows indicate surviving ADSCs and their nuclei. B: Post-MI hearts with ADSCs treatment were enzymatically digested, and small cells from the heart (<30 μm diameter) were collected after depletion of cardiomyocytes. As indicated with yellow arrow, GFP labeled cells represent surviving ADSCs under fluorescence microscope. Scale bar = 100 μm. C: Representative flow cytometric plots of surviving GFP+ ADSCs counted by FACS. Gate P1 indicates all the isolated cells from the heart for flow cytometric analysis. Gate P2 indicates the GFP+ cells out of gate P1. D: The percentage of survived ADSCs out of total transplanted ADSCs at different time points. N=4. *p<0.05 vs. GFP-ADSCs.


