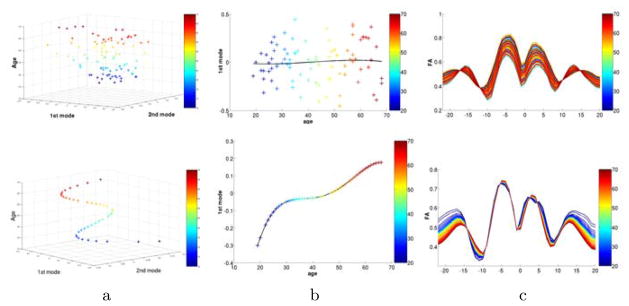
Fig. 3.

Results of the analysis of FA of the mid-cc tract with standard PCA (top) and constrained CPCA (bottom). Age is encoded in color. a) The first two modes plotted against age. b) Only first mode versus age with overlay of 4th order age regression. c) FA functions of 86 subjects projected onto the first component. Columns b and c demonstrate that data reduction by CPCA does encode a strong age-related relationship not seen in PCA (see random coloring in PCA versus age-sorted coloring in CPCA in column c).
