Fig. 5.

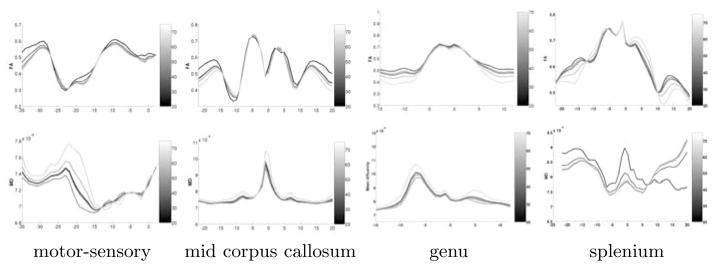
Reconstructed functions of FA (top row) and MD (bottom row) for four fiber tracts. Age is encoded as gray-scale for years 20, 30, 40, 50, and 60. Age-correlation of CPCA was significant for all 4 tracts (0.93, 0.98, 0.85 and 0.95).

Reconstructed functions of FA (top row) and MD (bottom row) for four fiber tracts. Age is encoded as gray-scale for years 20, 30, 40, 50, and 60. Age-correlation of CPCA was significant for all 4 tracts (0.93, 0.98, 0.85 and 0.95).