
Fig. 5.
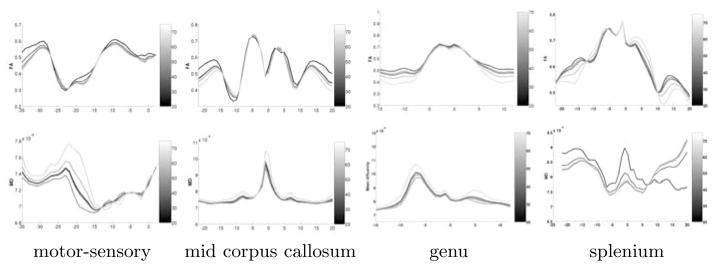
Reconstructed functions of FA (top row) and MD (bottom row) for four fiber tracts. Age is encoded as gray-scale for years 20, 30, 40, 50, and 60. Age-correlation of CPCA was significant for all 4 tracts (0.93, 0.98, 0.85 and 0.95).
Official websites use .gov
A
.gov website belongs to an official
government organization in the United States.
Secure .gov websites use HTTPS
A lock (
) or https:// means you've safely
connected to the .gov website. Share sensitive
information only on official, secure websites.
Reconstructed functions of FA (top row) and MD (bottom row) for four fiber tracts. Age is encoded as gray-scale for years 20, 30, 40, 50, and 60. Age-correlation of CPCA was significant for all 4 tracts (0.93, 0.98, 0.85 and 0.95).