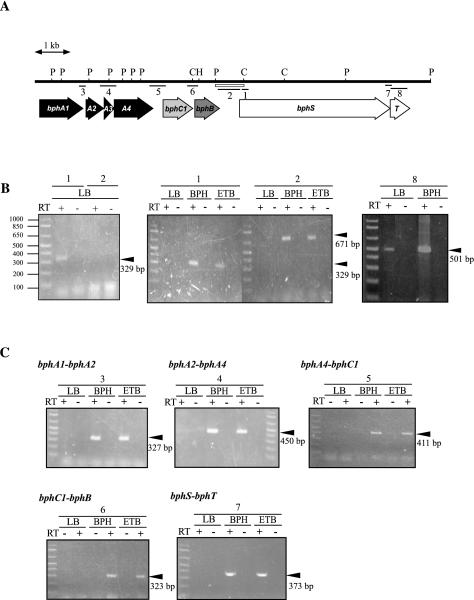
FIG. 7.
Transcription of the bphS gene in RHA1. (A) Physical map of the region from bphA1 to bphT. The open box below the map represents the fragment used to construct reporter plasmids pKLASF and pKLASR. The lines below the map indicate intergenic or internal segments of bph genes that were expected to be amplified by RT-PCR. The numbers below the lines indicate the PCR primer sets shown in Table 2. Restriction enzyme site abbreviations: P, PstI; C, ClaI; H, HindIII. (B) bphS and bphT gene transcripts in RHA1. Total RNAs from RHA1 cells grown on LB medium, on biphenyl (BPH), or on ethylbenzene (ETB) were reverse transcribed under the intensive conditions (left and right panels) or the usual conditions (center panel). The reverse transcripts were subjected to PCR amplification by using the primer sets indicated by the numbers above the panels, which correspond to the numbers in panel A and Table 2. RNA samples were concurrently analyzed in PCR mixtures with (+) and without (−) reverse transcriptase (RT) to verify the absence of total DNA. The position and size of each PCR product are indicated by an arrowhead on the right. (C) Intergenic RT-PCR products of the bphA1A2A3A4C1BST genes in RHA1. Total RNAs from RHA1 were reverse transcribed under the usual conditions, amplified, and analyzed as described above. An arrowhead indicates the position and size of each PCR product.

