Figure 1. Sampling scheme for S . polyschides (cells represent the sampling units) within 25 km cells along the study range, and for detailed northern-southern comparisons within sub-cells of 5 km.
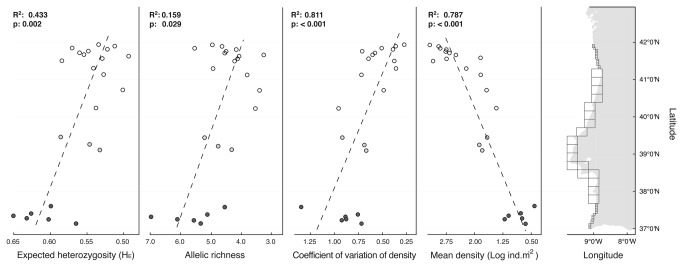
Expected heterozygosity (HE), allele number, coefficient of variation of density and mean density (values increase from right to left; North: white circles, Center: grey circles, South: black circles) plotted against latitude (decimal degrees at WGS84). R-squared and p-values for linear models (dashed lines) fitted for sites with density records and genetic samples.

