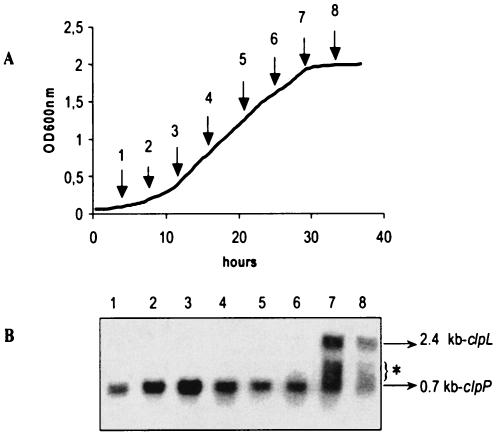
FIG. 2.
Expression of clpP and clpL as a function of growth phase. (A) Growth curve of O. oeni. Arrows indicate cells samples for RNA extraction. (B) Northern blot analysis of RNA samples 1 to 8 using the clpP- and clpL-specific probes P and L (at each of the eight sampling times indicated in panel A). In all cases, 20 μg of RNA was applied per lane. This experiment was carried out two times. Note that with longer time exposure, a 2.4-kb signal was weakly detected during the mid-exponential phase. The sizes of the transcripts detected are indicated, with 0.7 kb corresponding to clpP and 2.4 kb corresponding to clpL. An asterisk indicates transcript detected with the clpL probe, the size of which did not correlate with the entire clpL gene.

