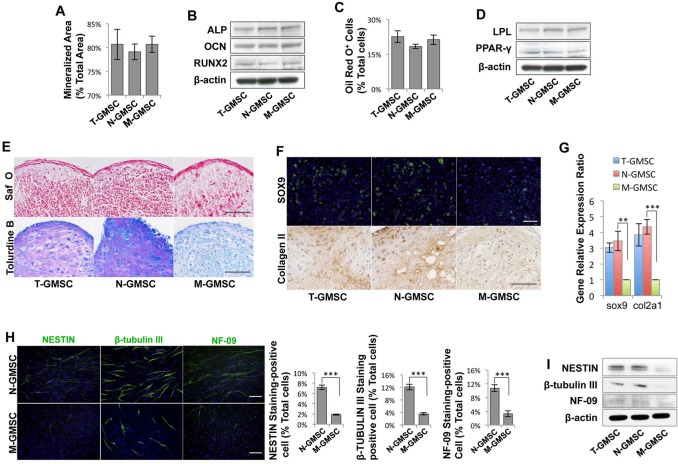
Figure 2.
Multi-lineage differentiation of N-GMSCs and M-GMSCs. (A) Semi-quantitative analysis of the percentage of alizarin-red-stained mineralized area vs. total area after cultured in osteoinductive conditions for 4 wks indicated that there was no significant difference between N-GMSCs and M-GMSCs in the formation of mineralized nodules. (B) Western blot analysis confirmed that N-GMSCs and M-GMSCs expressed the same levels of the osteogenic genes ALP, RUNX2, and OCN. (C) No significant difference was seen between N-GMSCs and M-GMSCs in the formation of Oil red O-positive adipocytes after culture in adipo-inductive conditions for 2 wks. (D) Western blot analysis confirmed that N-GMSCs and M-GMSCs expressed similar levels of the adipogenic markers PPARγ-2 and LPL. (E) Cell pellets derived from in vitro chondrogenic culture were sectioned and stained with safranin-O or toluidine blue. N-GMSCs showed more safranin-O- and toluidine-blue-positive areas than in the M-GMSC group. (F) Immunofluorescence staining showed that N-GMSCs expressed a high level of SOX-9-positive cells when compared with M-GMSCs. Immunohistochemistry staining also showed stronger COLLAGEN II expression in the N-GMSC group. (G) Real-time PCR identified that N-GMSCs expressed higher sox9 and collagen II on the gene level when compared with M-GMSCs. (H) After N-GMSC culture in the neural differentiation media for 21 days, immunocytostaining showed a significantly elevated expression of neurofilament M (NF-09), β-TUBULIN III, and NESTIN when compared with M-GMSCs (n = 5). (I) Western blot analysis confirmed that N-GMSCs expressed higher levels of neurogenesis protein NF-09, β-TUBULIN III, and NESTIN compared with M-GMSCs. **p < .01, ***p < .001; Error bars: mean ± SD. Scale bar = 100 μm.

