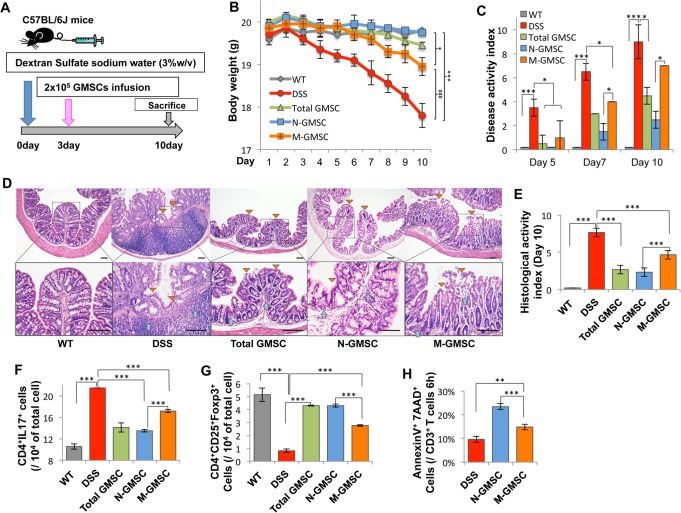
Figure 3.
N-GMSCs can ameliorate disease phenotype in dextran sulfate sodium (DSS)-induced experimental colitis. (A) Schema showing GMSC infusion in mice with DSS-induced experimental colitis. (B) Mice with colitis (colitis, n = 5) showed significantly reduced body weight from days 5 to 10 after DSS induction. N-GMSC (n = 5), M-GMSC (n = 5), and total GMSC (T-GMSC, n = 5) transplantation reduced body weight loss compared with that of the colitis group (n = 5) at 10 days post-DSS induction. However, the N-GMSC and T-GMSC groups showed more significant reduction of body weight loss than did the M-GMSC group (*p < .05 vs. C57BL/6J; ***p < .001 vs. C57BL/6J; ###p < .001 vs. M-GMSCs). (C) Disease activity index (DAI) was significantly increased in mice with colitis compared with the C57BL/6J control mice (n = 5) from days 5 to 10 post-DSS induction. Although all GMSC infusion groups showed significantly reduced DAI scores, the N-GMSC and T-GMSC groups demonstrated superior reduction when compared with the M-GMSC group. (D) Hematoxylin and eosin (H&E) staining showed the infiltration of inflammatory cells (blue arrows) in the colon, with destruction of the epithelial layer (yellow triangles) in mice with colitis. N-GMSC transplantation exerted more significant restoration of disease phenotype in the colon and reduction of histological activity index (E) compared with those in the M-GMSC group. (F) The Th17 cell level was significantly elevated in mice with colitis compared with C57BL/6J control mice at 10 days post-DSS induction. Compared with the M-GMSC group, N-GMSC infusion showed a significant effect in reducing the levels of Th17 cells in mice with colitis at 10 days post-DSS induction. (G) Treg level was significantly reduced in mice with colitis compared with C57BL/6J control mice at 10 days post-DSS induction. N-GMSC infusion exhibited stronger capacity to up-regulate the Treg levels in mice with colitis compared with the M-GMSC group. (H) By flow cytometric analysis, N-GMSC (n = 3) infusion showed marked elevation in the number of apoptotic CD3+ T-cells compared with those in the M-GMSC group at 6 hrs post-infusion in mice with colitis. Scale bar = 200 μm; *p < .05; **p < .01; ***p < .001. Error bars: mean ± SD.

