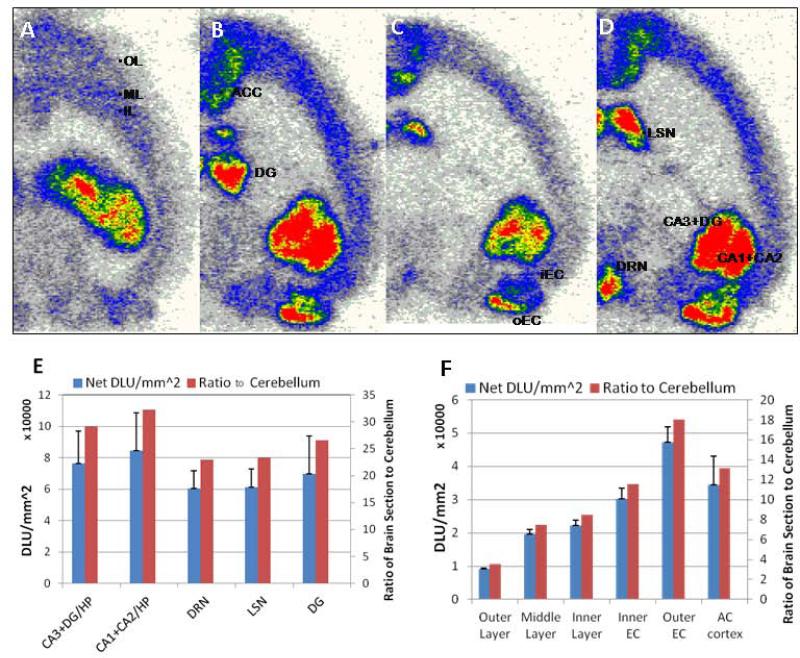
Figure 6.
(A-D). Ex vivo horizontal brain slices of rodent brain showing binding of [18F]mefway (red = highest binding and white = lowest binding; OL=outer layer of cortex; ML= middle layer of cortex; IL=inner layer of cortex; ACC=anterior cingulated cortex; DG= dentate gyrus; iEC= inner enthorinal cortex; oEC= outer enthorinal cortex; LS= lateral septal nuclei; DRN= dorsal raphe nucleus; CA1, CA2, CA3= hippocampal regions). (E). Quantitation of [18F]mefway binding in hippocampal regions, dorsal raphe and septal nuclei in ex vivo autradiographs and ratio with respect to the cerebellum; (F). Quantitation of [18F]mefway binding in cortical layers in ex vivo autradiographs and ratio with respect to cerebellum.

