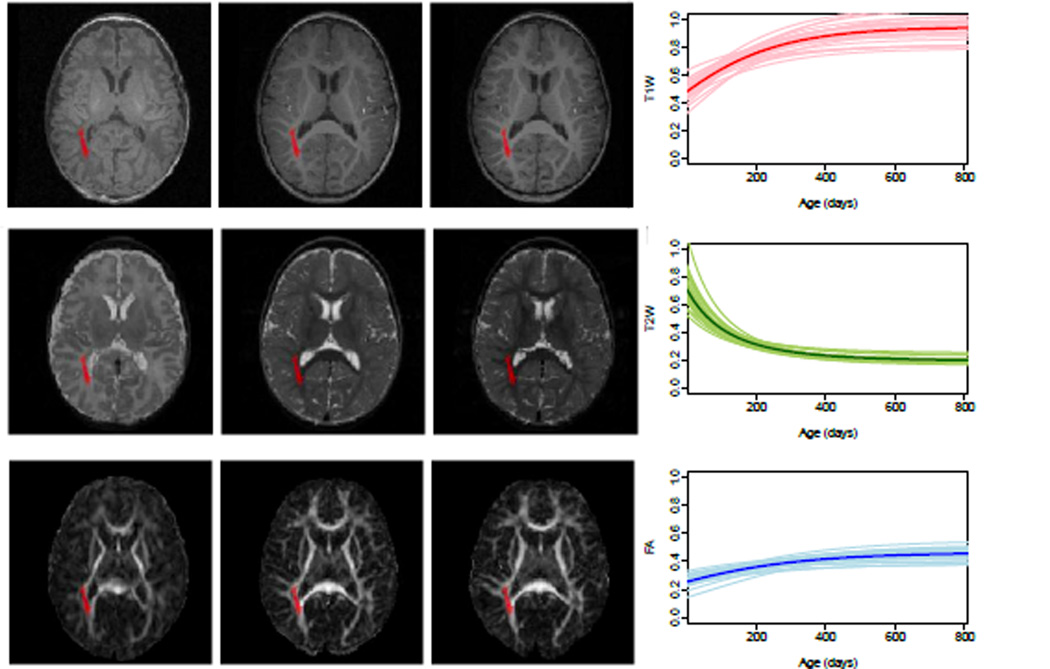
Fig. 1.
Co-registered multi-modal MRI data are shown on the left. Left to Right: Images taken at two weeks, 1 year and 2 years. Top to Bottom: T1W, T2W and FA. Posterior thalamic radiation is shown as red label on the images. Population and individual growth trajectories for this region is shown to the right. Thick curves are the average growth trajectories for normalized T1W, T2W and FA.

