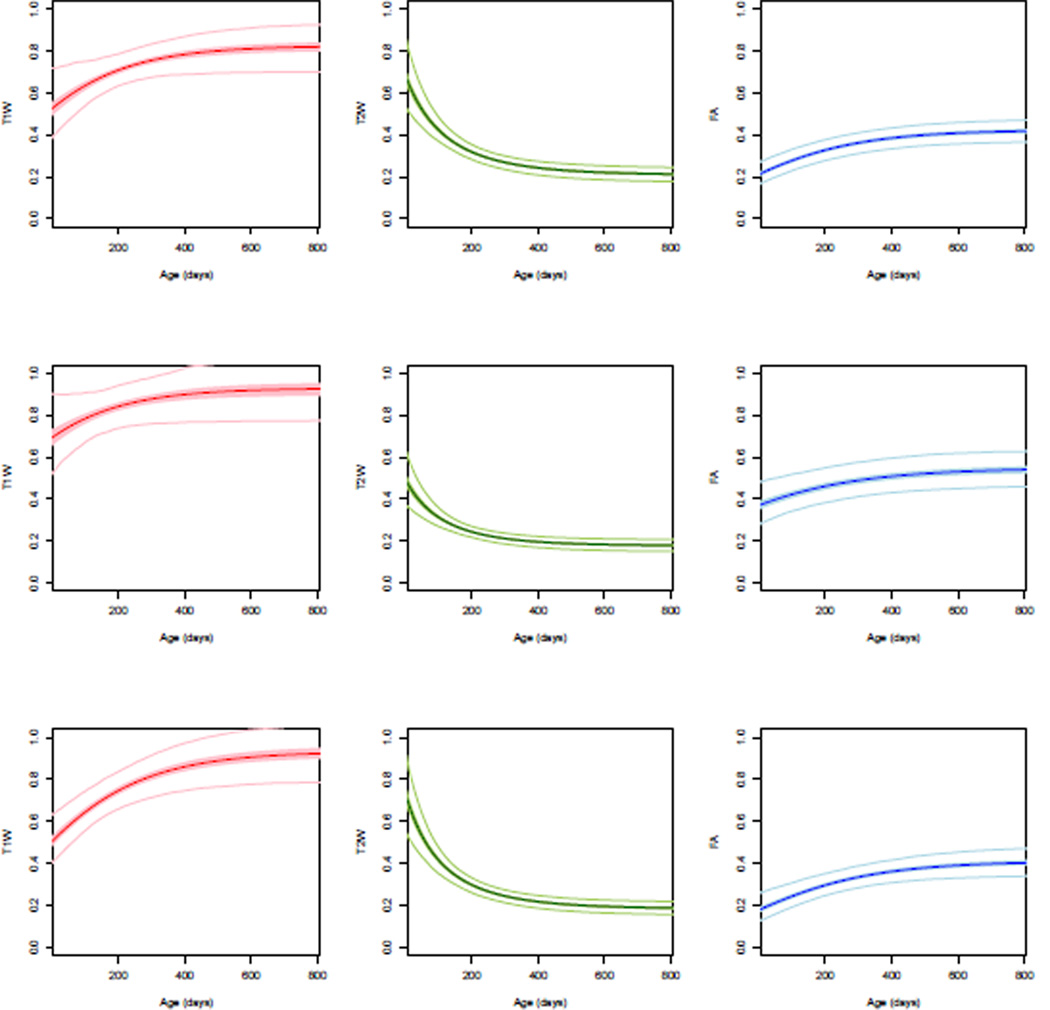
Fig. 2.
Population growth trajectories (bold) and confidence intervals (light). From top to bottom: Body of Corpus Callosum (BCC), Posterior Limb of Internal Capsule (PLIC), and Superior Longitudinal Fasciculus (SLF). Bold curves are the average growth trajectories for normalized T1W (red), T2W (green) and FA (blue), while the 95% confidence interval of the curves are shown as shaded regions. Light color curves show the 95% predicted intervals for each region.

