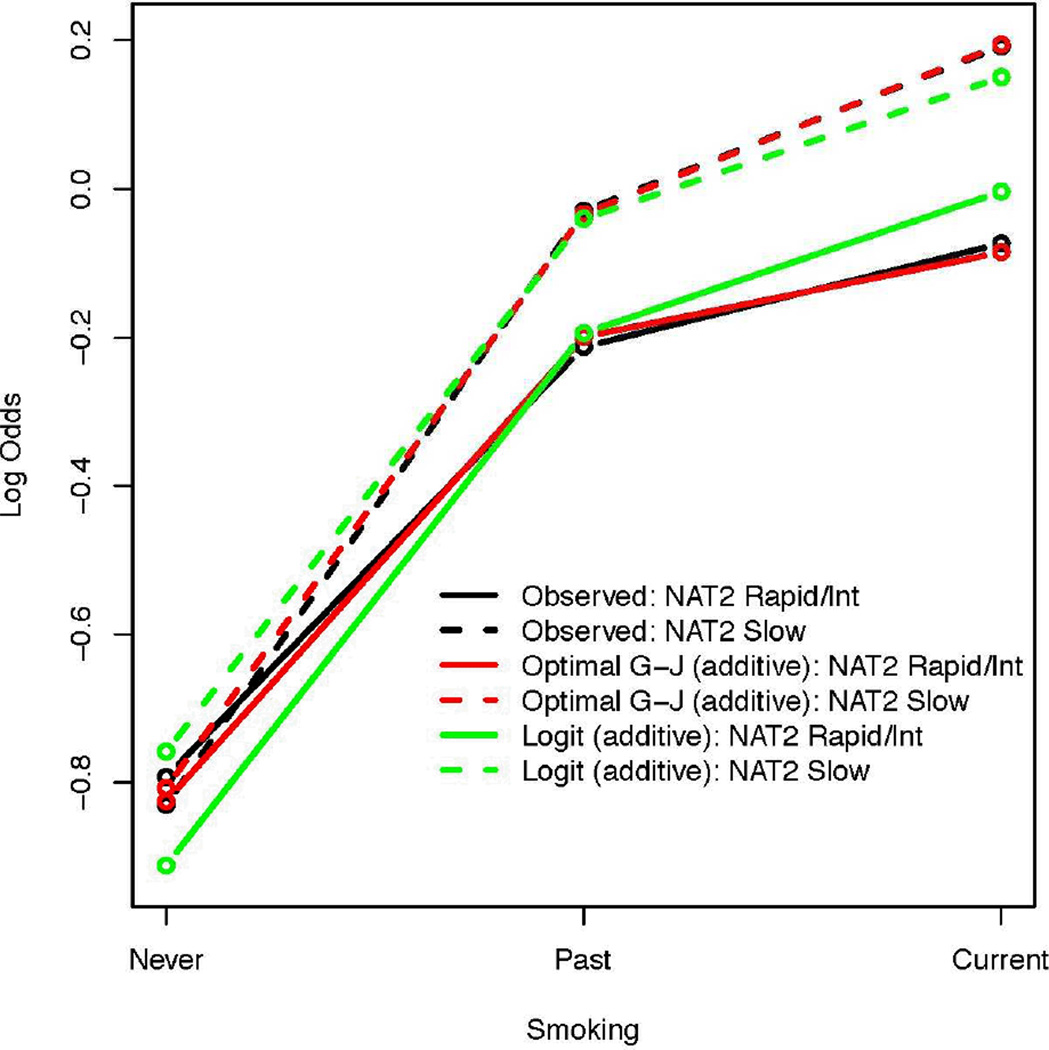
Figure 5.
Estimated log odds ratios for the bladder cancer study. The horizontal axis shows the three levels of smoking. The vertical axis shows the log odds. The observed log odds for NAT2 rapid/intermediate acetylators and slow acetylators are shown in black bold and dashed lines, respectively. The estimated log odds under the full logistic model coincide with the observed values. The estimates obtained under the additive logistic model for NAT2 rapid/intermediate acetylators and slow acetylators are shown in green bold and dashed lines, respectively. The estimates based on the optimal additive GJ model for NAT2 rapid/intermediate and slow acetylators are shown in red bold and dashed lines, respectively.

