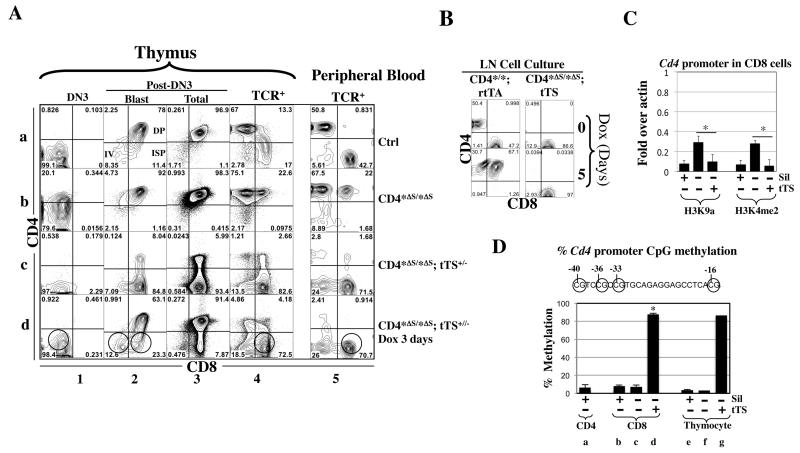
Fig. 5. tTS epigenetically silenced Cd4 in CD8 and early T cells at the Cd4* allele lacking the Cd4 silencer.
(A) Effects of tTS on CD4 expression in mice homozygous for the CD4*Δs allele. Cd4*/* mice were used as control (Ctrl). Cells were analyzed as in Fig. 4A. The red and green circles mark the cells with irreversible and reversible Cd4 repression, respectively. Note that in the presence of tTS, the fluorescence from the anti-CD4 antibody in DN3 cells was even weaker than the control (column 1, rows c vs. a), which is unrelated to Cd4 repression because the DN3 cells in the control mice do not express CD4.
(B)Mitotic stability of tTS-induced silencing. LN cells from Cd4*/*; rtTA+/+ or Cd4*Δs/*Δs; tTS+/− mice were stimulated with anti-CD3/CD28 and cultured in the presence of Dox (100ng/ml) and IL-2. Of note, after 5 days of culture, CD8 cells had preferentially expanded relative to CD4 cells (compared left top with left bottom; see also Fig. S1B). Cells were analyzed as in Fig. S1B.
(C)ChIP assays comparing the effects of Cd4 silencer vs. tTS on histone modifications at the Cd4 promoter in CD8 cells. CD8 cells were isolated from Cd4*Δs/*Δs (Sil−tTS−) or Cd4*Δs/*Δs; tTS+/− (Sil−tTS+) mice, with the former CD8 cells all de-repressing CD4. Values were averaged from 2-3 mice. The values for the control CD8 cells (Sil+ tTS−) were copied from Fig. 4F. Asterisks indicate significant effects of tTS (p<0.05).
(D) Pyrosequencing measuring DNA methylation at the Cd4 promoter (−101 to +1) harboring four CpGs (circles). The methylation levels at these CpG were similar and the values averaged. For each condition, two mice are analyzed and the mean values, except that Conditions f and g involve one mouse. Mouse genotypes are labeled as in Fig. 5C. Asterisks indicate significant effects of tTS.

