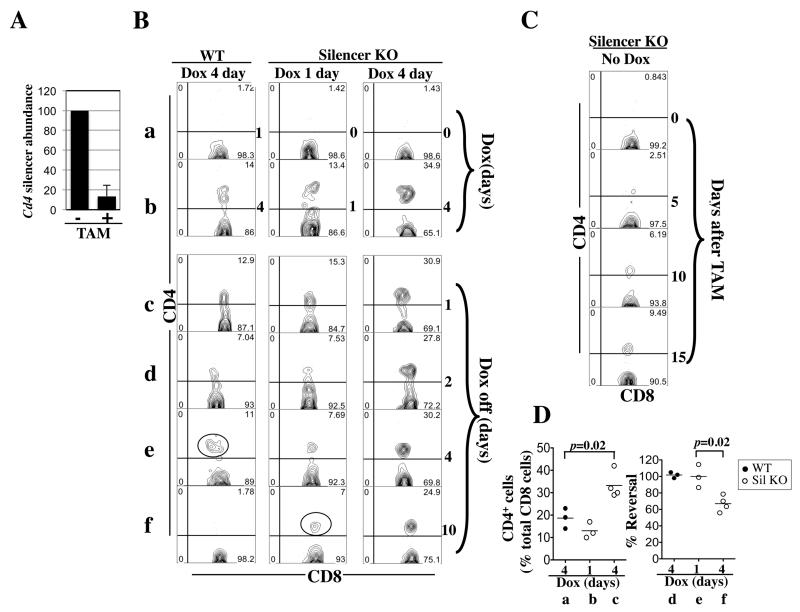
Fig. 6. Induction and reversal of CD4 expression in CD8 cells in Cd4*/+; rtTA+/−; ER-Cre+/− mice.
(A) qPCR quantifying Cd4 silencer in peripheral blood CD8 cells before (−) and after (+) TAM injection. TAM (2 mg) was injected daily for three days. The Cd4 silencer abundance 24 hours after the last injection was displayed as the percentage of that before injection. Data were averaged from three mice.
(B) Five-weeks-old mice were exposed to Dox (1mg/ml) for four days (column 1) or pretreated with TAM to remove the Cd4 silencer before Dox challenges for one or four days (columns 2-3). The FACS plots show the CD4/CD8 expression pattern of CD8 cells (CD8+TCR+) cells in the peripheral blood at various time points (as indicated at the right side of the plots) during the induction (rows a-b) and reversal (rows c-f) of CD4 expression. The cells marked by red circle in column 1 and 2 are probably recent thymic emigrants.
(C) Same as (A) except the mice were treated with TAM only.
(D) Data from two independent experiments were pooled to show the effects of silencer deletion on the induction (left) and reversal (right) of Cd4 expression in CD8 cells. The induction efficiency is the percentage of CD4+ CD8 cells among total CD8 cells at the end of Dox challenge. The reversal efficiency is the percentage of the CD4+ CD8 cells that had managed to restore Cd4 repression on Day 10 after Dox withdrawal, calculated after correcting for the averaged percentage of CD4+ CD8 cells observed in silencer-deleted mice lacking Dox challenge. A total of 3-4 mice in each group were analyzed.

