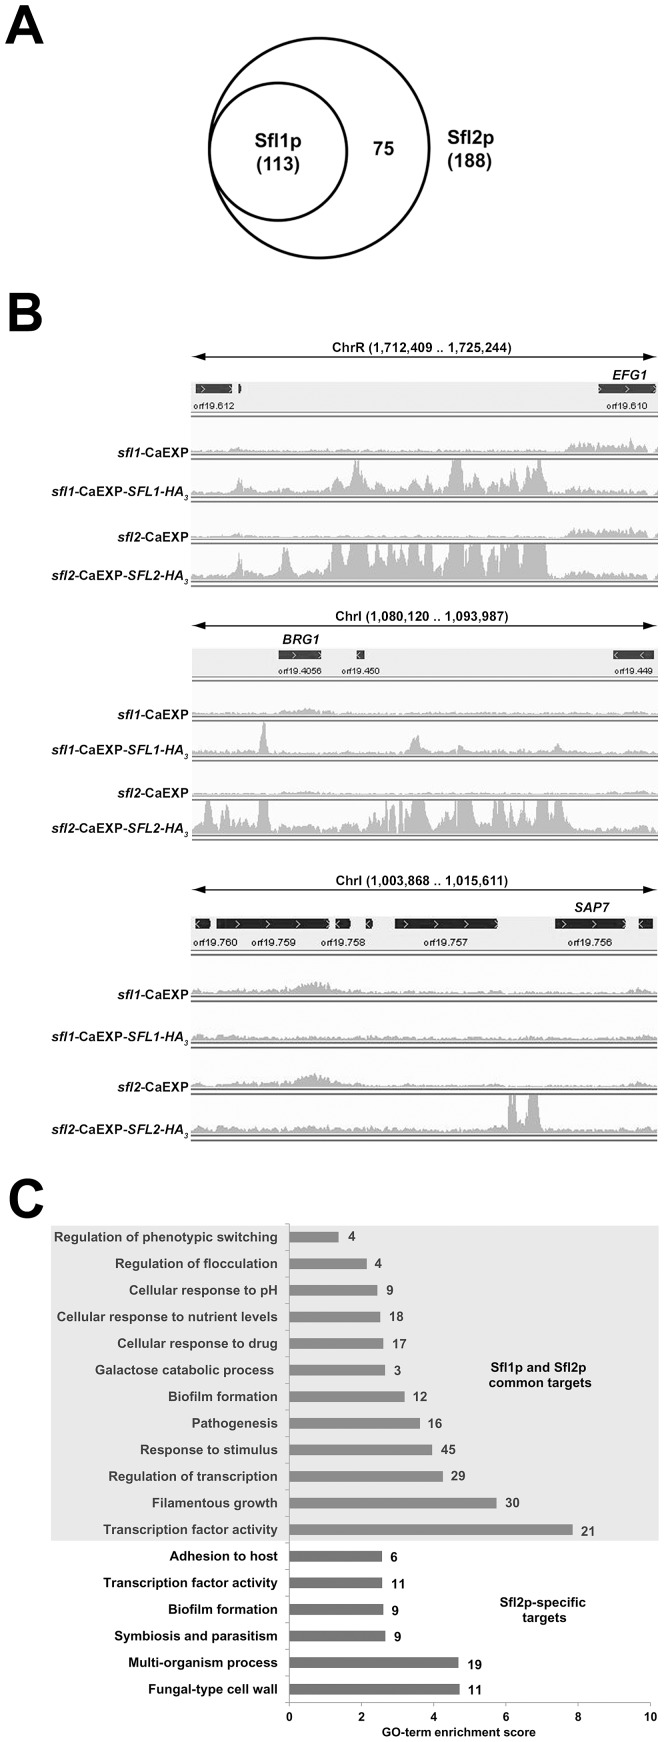
Figure 2. Genome-wide location of Candida albicans Sfl1p and Sfl2p, in vivo, at a single-nucleotide resolution.
(A) Venn diagram of the overlap between Sfl1p and Sfl2p binding targets. All 113 Sfl1p targets are also bound by Sfl2p, while 75 target promoters are Sfl2p-specific. The total number of Sfl1p or Sfl2p target promoters are indicated between parentheses. Target promoters include those that are clearly associated with given ORFs as well as those that are shared by two ORFs in opposite orientations. (B) A single-nucleotide resolution of Sfl1p and Sfl2p binding at selected C. albicans genomic regions in vivo. Plotted are read-count signal intensities of HA3-tagged SFL1- (sfl1-CaEXP-SFL1-HA3) or SFL2- (sfl2-CaEXP-SFL2-HA3) coimmunoprecipitated DNA and the corresponding empty-vector control signals (sfl1-CaEXP, sfl2-CaEXP, respectively) from merged BAM files of two independent biological replicates. Some read-count signals extend beyond the maximum graduation (not shown) that ranges between 0–500 reads for Sfl1 data (sfl1-CaEXP and sfl1-CaEXP-SFL1-HA3) and 0–1000 reads for Sfl2 data (sfl2-CaEXP and sfl2-CaEXP-SFL2-HA3). The position of each signal in selected C. albicans genomic regions from assembly 21 is shown on the x-axis. The location of each selected region from the corresponding chromosome (Chr) is indicated at the top of each panel (limits are shown between parentheses in base pairs). The orientation of each ORF is depicted by the arrowed black rectangle. (C) Enrichment scores of the Gene Ontology (GO) terms to which are assigned Sfl1p and Sfl2p common (shaded area) or Sfl2p-specific (unshaded area) binding targets. GO term enrichment scores are calculated as the negative value of the log10-transformed P-value. The number of genes of each category is shown at the right of each horizontal bar.

