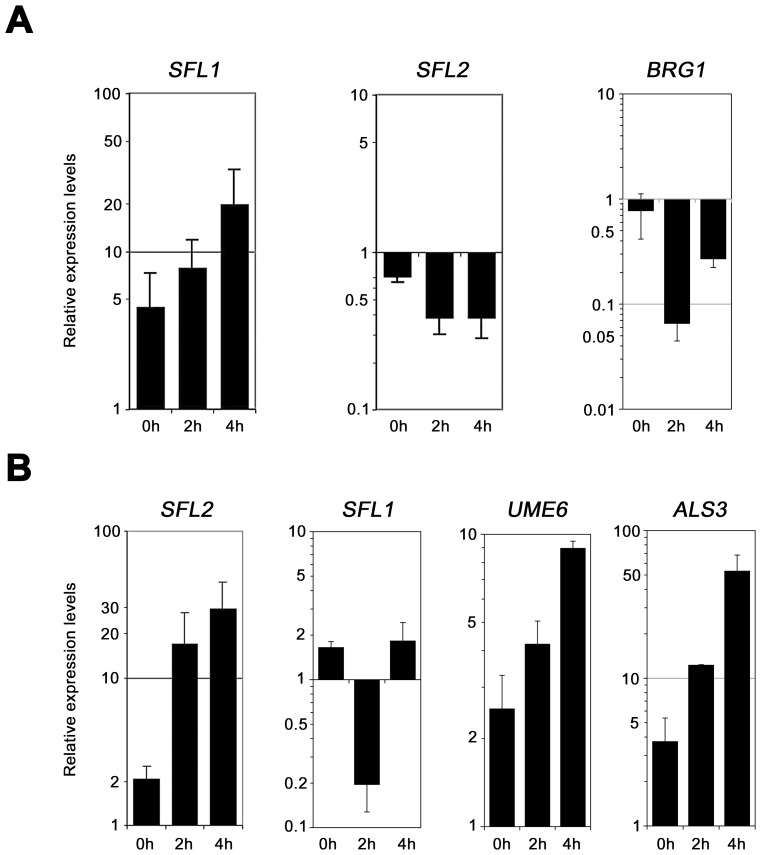
Figure 5. Quantitative real-time RT-PCR analysis of selected genes from SFL1 and SFL2 transcriptomics data.
(A) Expression of the SFL1, SFL2 and BRG1 genes was quantified by qRT-PCR experiments in SFL1-deficient strains carrying or not a functional SFL1-TAP fusion [41] and grown during 0, 2 and 4 hours under gluconeogenic conditions (CEC2001 and CEC1997, respectively, Table 1). Expression of the SFL2 and BRG1 genes is repressed upon SFL1 expression. Logarithmic scales are shown in each panel. (B) Expression of the SFL2, SFL1, UME6 and ALS3 genes was quantified by qRT-PCR experiments in an SFL2-deficient strain carrying or not a functional SFL2-TAP fusion [41] and grown during 0, 2 and 4 hours under gluconeogenic conditions (CEC1509 and CEC1535, respectively). Expression of the SFL1 gene is repressed at time point 2 h, whereas those of UME6 and ALS3 are induced. Logarithmic scales are shown in each panel. Bars in each graph indicate log-transformed relative changes in RNA expression of the indicated samples as compared to the CEF3 calibrator control (see Materials and Methods). Error bars denote standard deviations.

