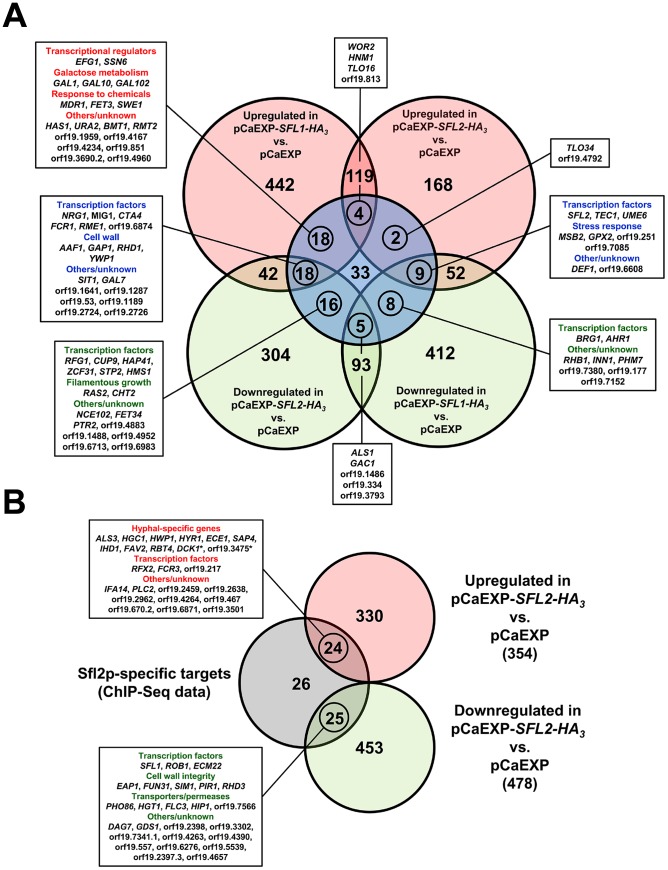
Figure 6. Sfl1p and Sfl2p transcriptional modules.
Venn diagrams of the overlap between the genes that are modulated in (A) SFL1 or SFL2 transcriptomics (light red circles, upregulated; light green circles, downregulated; gene expression fold-change cut-off ≥1.5; P-value cut-off ≤0.05) and commonly bound by Sfl1p and Sfl2p (light blue circle) or (B) SFL2 transcriptomics (light red circle, upregulated; light green circle, downregulated; gene expression fold-change cut-off ≥1.5; P-value cut-off ≤0.05) and specifically bound by Sfl2p (light grey circle). Numbers in the Venn diagrams indicate the number of genes. Circled numbers indicate the number of genes that are (A) both modulated in SFL1 or SFL2 transcriptomics data and commonly bound by Sfl1p and Sfl2p or (B) both modulated in SFL2 transcriptomics data and specifically bound by Sfl2p. The name of these genes (or their orf19 nomenclature) and the functional categories to which they belong are shown in the linked boxes. *, DCK1 is required for hyphal formation; orf19.3475 is a hyphal induced gene.

