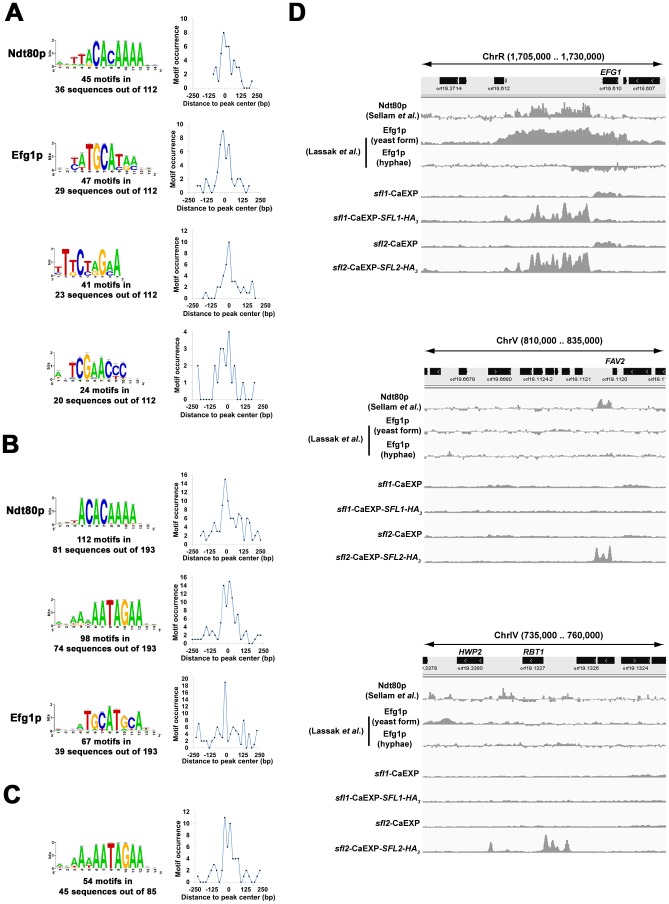
Figure 8. Sfl1p and Sfl2p binding locations overlap with those of Ndt80p and Efg1p.
(A, B and C) Motif discovery analyses of Sfl1p and Sfl2p binding data. Motif logos of conserved sequences in (A) Sfl1p- and (B) Sfl2p-enriched DNA fragments as well as in (C) fragments overlapping with binding regions that are specific to Sfl2p. DNA sequences encompassing ±250 bp around peak summits in Sfl1p or Sfl2p binding data were used as input for motif discovery using two independent motif discovery algorithms, the RSA-tools (RSAT) peak-motifs (http://rsat.ulb.ac.be/rsat/, [55]) and SCOPE (genie.dartmouth.edu/scope/, [56]) (See Materials and Methods for details). High scoring motifs from either SCOPE or RSAT algorithms are shown. These include the Ndt80p and Efg1p binding motifs, suggesting a functional interaction between Sfl1p, Sfl2p, Ndt80p and Efg1p. The distribution of motif occurrences in the input sequences are shown at the right of each motif panel. Plotted are the number of occurrences of each motif (y-axis, motif occurrence) at a given position relative to peak center (distance to peak center in base pairs, x-axis). (D) Overlap of Ndt80p and Efg1p binding with Sfl1p and Sfl1p occupancies at selected locations from the C. albicans genome (selected genome interval shown above each panel). Genome-wide location data from Sellam et al. (Ndt80p, from 59-bp tiling array data, one of the two replicates of the study is shown [57]) and Lassak et al. (Efg1p, from 50–75-mer tiling array data for Efg1p binding in cells grown under yeast form and during hyphal induction [51], one of the three replicates in each condition is shown) are used to compare Ndt80p and Efg1p binding profiles to those of Sfl1p and Sfl2p (read counts in 10 bp windows from wiggle files of Sfl1p and Sfl2p binding data were used).

