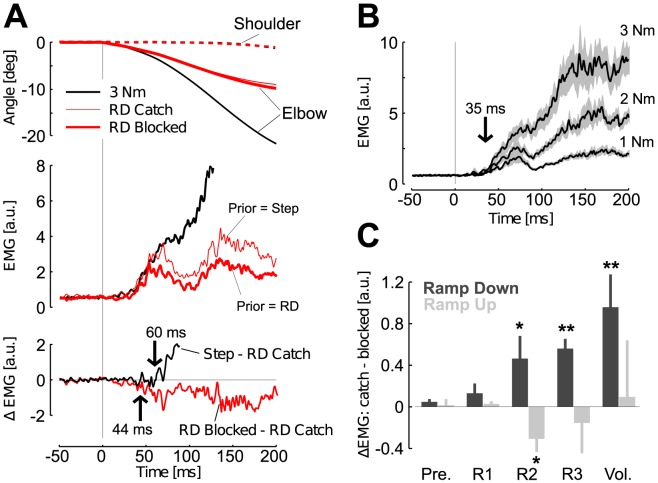
Figure 6. Experiment 1: Muscle responses.
A: Top: Average shoulder (dashed) and elbow (solid) joint displacements following extension torques in three different cases, 3 Nm step torques (black), and ramp-down profiles in catch and blocked conditions (thin and thick red traces, respectively) averaged across subjects. Shoulder motion was identical across all conditions and the corresponding traces are superimposed. Middle: Perturbation-evoked response recorded from an elbow flexor (brachioradialis) with the same color code as in the top panel. Bottom: Difference between the 3 Nm step response and the ramp-down in the catch condition (black), and between ramp-down torques in the block and catch (red). Arrows indicate the onset of divergence from the 3 Nm evoked response. B: Response evoked by step-torque perturbations averaged across subjects. The shaded area represents the standard error. The vertical arrow depicts the latest divergence onset across all pair-wise comparisons. C: Changes in evoked response across the conditions where ramp-down (dark gray) or ramp-up (light gray) perturbations were presented in catch or blocked design. The grand average of Brachioradialis and Triceps Lateralis responses was considered for this analysis. Positive designates that the evoked activity decreased in the block condition.

