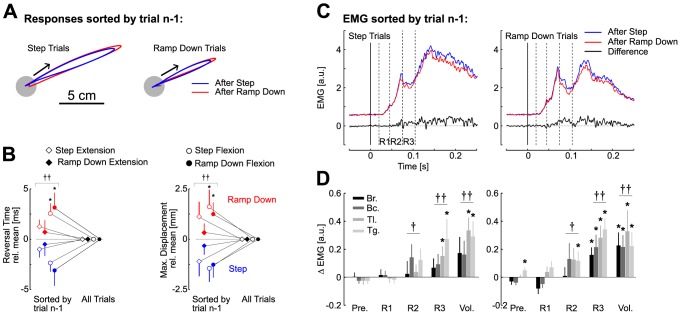
Figure 7. Results of experiment 2.
A: Average hand path from one representative subject following step torques and ramp-down torques sorted by trial n-1. The blue traces are the average across all trials preceded by a step perturbation and the red traces are the average across all trials preceded by a ramp-down perturbation. B: Trial-by-trial modulation of the corrective response depending on the preceding trial for step (open symbols) and ramp-down (filled symbols) flexion and extension perturbations (disk and diamond, respectively). Significant differences in data from single perturbation profile (*) and from all perturbation pooled together (†) are shown at the level P<0.05 (one symbol) and P<0.01 (two symbols). C: Grand average across the four muscles of interest and across subjects of trials sorted by trial n-1 with identical color code as in panel A for step torques (left) and ramp-down (right) torque profiles. The black traces are the differential signals between blue and red responses. The dashed vertical lines represent the different epochs of rapid motor responses (see Methods). D: Binned analysis of the difference in activation across responses preceded by step torques and responses preceded by ramp-down torques for the four muscles of interests following step perturbations (left) and ramp-down perturbations (right). As in panel C, positive designates an increased activity when the trial is preceded by a step perturbation. Bars represent one standard error across the 12 subjects. From dark gray to light gray, displays are Brachioradialis (Br.), Biceps (Bc.), Triceps Lateralis (Tl.), and Triceps Long (Tg.). Stars indicate significant modulation of the corresponding muscle at the level P<0.05 and the dagger (†) indicates significant modulation from all muscle samples pooled together (one symbol, P<0.05; two symbols, P<0.01).

