
Figure 9. Effect of unexpected changes in perturbation magnitude.
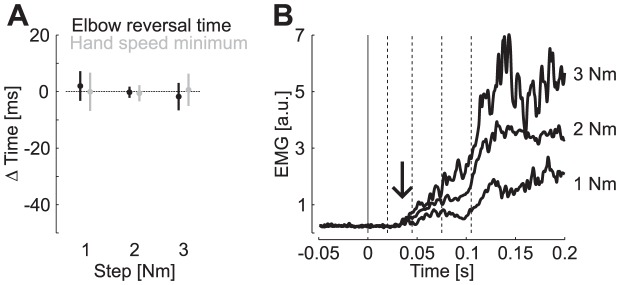
A: Reversal times and hand speed minima across the tested values of step magnitudes as presented in Figure 4 C. We used the same scale as in Figure 4 C to emphasize that unexpected changes in step magnitude could not account for the effect of ramp profiles on the times of reversal or hand speed minima. B: Perturbation evoked response from Brachioradialis averaged across subjects. The vertical arrows illustrate the latest onset of divergence across all pair wise comparisons based on ROC analysis (35 ms).