
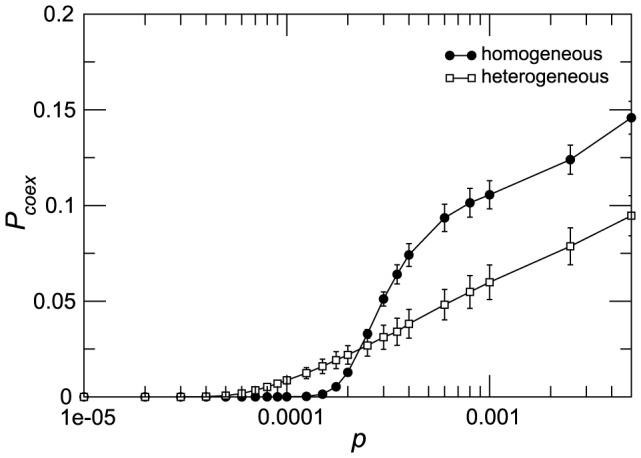
Figure 3. Coexistence probability within the same patch.
 is defined as the probability that within the same subpopulation both strains produce at least
  of the population infected. The quantity plotted is the average and the standard deviation over 2000 runs. The parameters used for the simulations are the same as in Figure 2.