
Figure 7. Dependence of the cross-over diffusion rate on the epidemiological parameters.
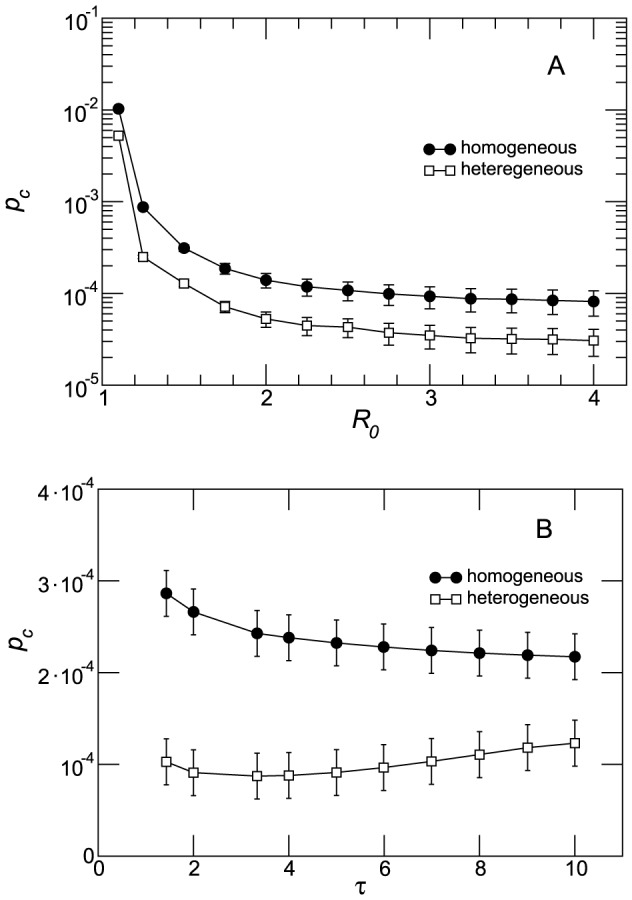
Cross-over diffusion rate  along with estimation error as a function of the reproductive number
  (A) and of
  (B) in the homogeneous and heterogeneous cases. The networks have average degree
  . Other parameters are
  ,
,  (A) and
  (B).
(B).