
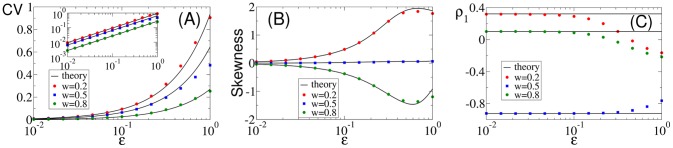
Figure 10. Comparison of ISI statistics from numerical simulation and theory versus noise strength  for different values of the frequency ratio
  as indicated in the legends: coefficient of variation (A) with a double logarithmic plot of the same data in the inset, skewness of ISI density (B), and serial correlation coefficient at lag one (C).
Remaining parameters:  ,
,  ,
,  , and
, and  .
.