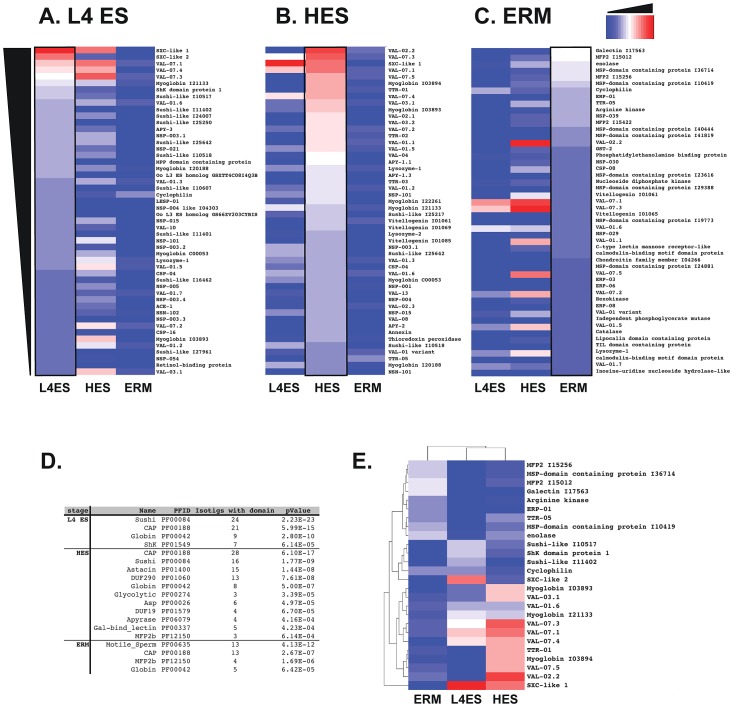
Figure 4. Comparison of protein abundance (emPAI) in each ES product.
A. The 50 most abundant proteins in L4 ES, ranked by emPAI score (left column) with corresponding emPA scores for HES (centre) and ERM (right column). Scores are coloured on a log2 scale with red maximum and blue minimum. B. The 50 most abundant proteins in HES ranked as above (centre column) with corresponding scores for L4 ES and ERM. C. The 50 most abundant proteins in ERM ranked as above (right column) with corresponding scores for L4 ES (left column) and HES (centre). D. Protein family (Pfam) enrichment within each ES, ranked by statistical significance (cut-off of p<0.001) compared to Pfam in total transcriptomic assembly. “Isotigs with domain” indicates number of times domain present in indicated ES. Full analyses are provided in Table S5. E. Two-way clustering of the 10 most abundant proteins in the 3 ES preparations.

