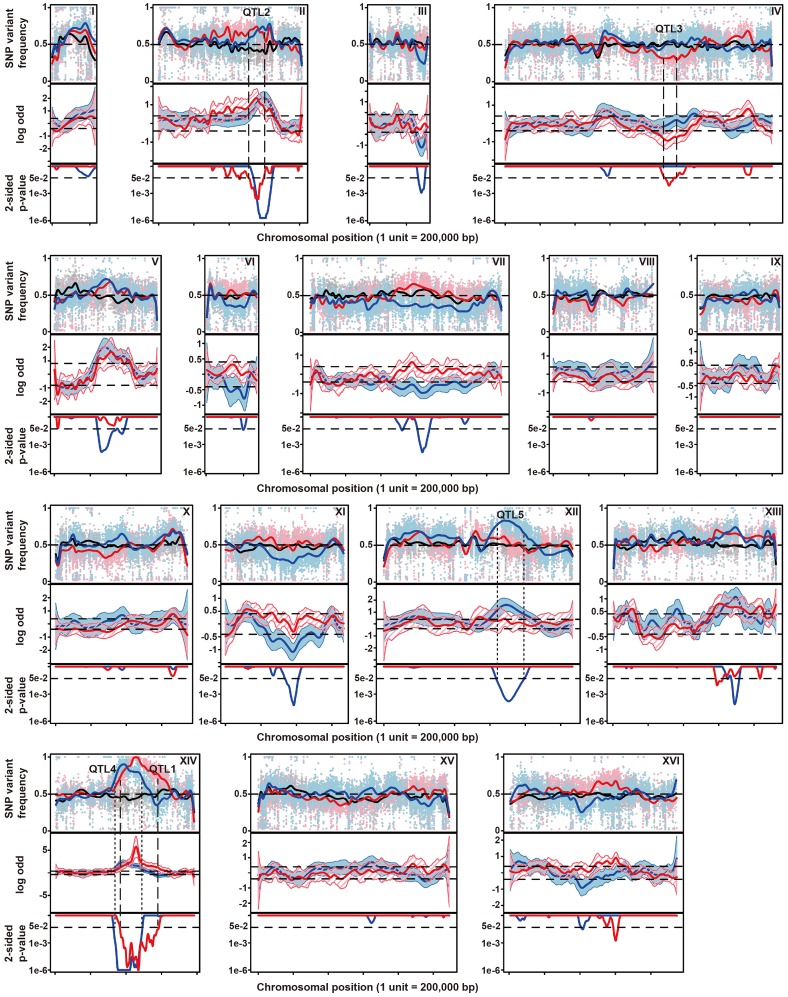
Figure 2. Genetic mapping of QTLs involved in thermotolerance by pooled-segregant whole-genome sequence analysis.
Genomic DNA samples were extracted from an unselected pool (pool 0) and two pools of thermotolerant segregants able to grow at 41°C (Pool 1) and at 40.7°C (Pool 2), respectively. The DNA for each pool originates from 58 segregants. Pool 1 consists of segregants from the cross between parents 21A and BY4742 and Pool 0 and Pool 2 from the cross between the downgraded parents 21ADG and BY4742DG. The top-panel represents the SNP variant frequency of pool 0 (small gray circles), pool 1 (small pink triangles) and pool 2 (small blue diamonds) along with the smoothed SNP frequency profile (black line: pool 0, red line: pool 1 and blue line: pool 2) using a generalized additive model. In the middle panel the log odds ratio (contrast) between the SNP variant frequency of a selected pool and pool 0 is plotted along with simultaneous 95% confidence bands (red region: pool 1 and blue region: pool 2). Horizontal dash lines indicate the threshold (δ = 0.4088). The bottom panel shows 2-sided p-values along the chromosome that are corrected for multiple testing, with horizontal dash lines indicating a cut-off of 0.05. Confirmed QTLs are indicated at corresponding positions, with broken lines indicating QTLs from the original parents, and stippled lines QTLs from the downgraded parents.

