
Figure 3. Dissection of QTL1 to identify the causative gene.
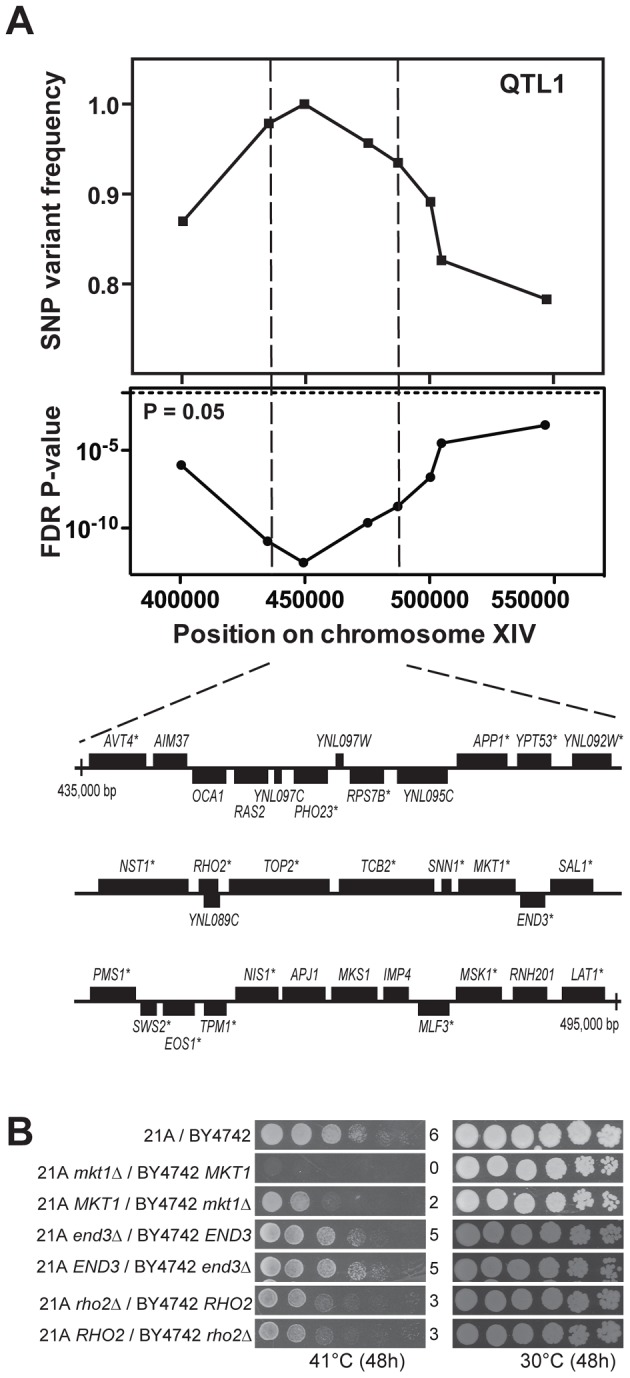
(A) Fine-mapping of QTL1 by scoring selected SNPs in the individual thermotolerant segregants. Eight SNPs spanning between 400,000 bp and 550,000 bp on chromosome XIV were scored by PCR in 46 thermotolerant segregants and both SNP variant frequency and FDR p-value were calculated. A 60,000 bp region between SNP2 and 5 showed the strongest linkage. It contained 33 genes and putative ORFs as indicated using the annotations in SGD. The genes containing at least one non-synonymous mutation within the ORF are indicated with an asterisk. (B) Identification of the causative gene MKT1 in QTL1. RHA results for MKT1, RHO2 and END3 in the central region of QTL1 are shown. The strain pairs for the same genes were always spotted on the same plate. The results for the original hybrid diploid 21A/BY4742 and the MKT1 reciprocal deletion strains were also from the same plate.