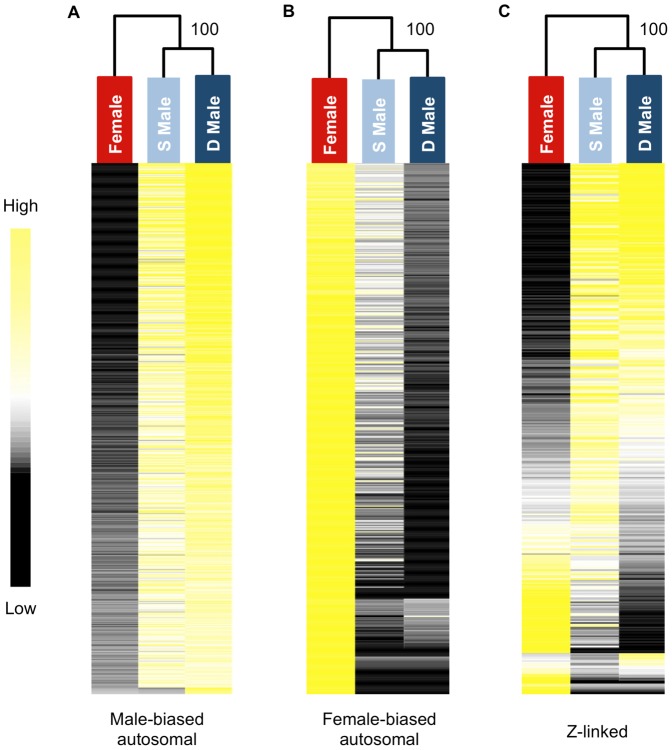
Figure 1. Heat maps and hierarchical clustering of gene expression for females, subordinate males and dominant males.
Shown is the relative expression for autosomal male-biased (n = 2,217, panel A), female-biased (n = 2,908, panel B) and Z-linked (n = 364, panel C) genes. Hierarchical gene clustering is based on Euclidean distance for average log2 expression for each gene for the three sexual morphs. The number at each node is the percentage bootstrap result from 1000 replicates.

